Forex candlestick patterns are visual representations of price movements in the foreign exchange market. They are formed by the open, high, low, and close prices of a currency pair over a specific period, typically shown in a candlestick chart. Candlestick patterns are used by traders to analyze market sentiment and predict potential price movements. Here are a few common candlestick patterns:
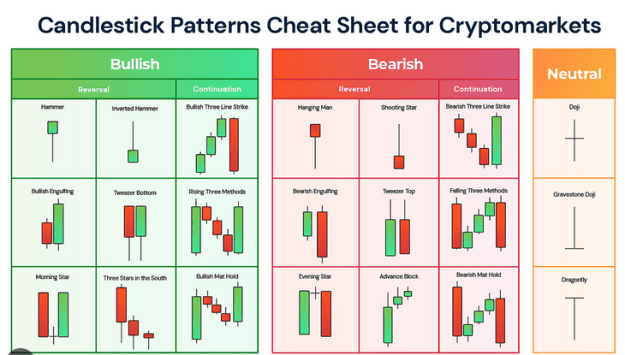
1. **Doji**: A doji occurs when the open and close prices are virtually the same, resulting in a small or non-existent body and long upper and lower wicks. It suggests indecision in the market.
2. **Hammer and Hanging Man**: These patterns have small bodies and long lower wicks. The hammer appears at the bottom of a downtrend and signals a potential reversal to the upside, while the hanging man appears at the top of an uptrend and signals a potential reversal to the downside.
3. **Engulfing Pattern**: This pattern consists of two candles, where the body of the second candle completely engulfs the body of the first candle. A bullish
..read more and download here
Attached Image (click to enlarge)