The Heikin Ashi strategy is a popular approach in technical analysis, particularly in trading. Heikin Ashi charts are similar to candlestick charts but use a modified formula to calculate each candle's open, close, high, and low values. The resulting charts smooth out price movements and make trends easier to identify.
Here's a simple Heikin Ashi strategy that traders often use:
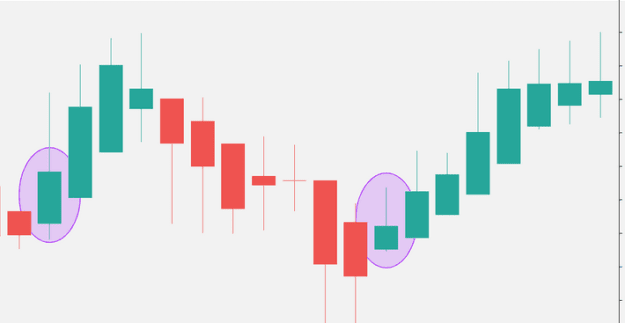
Trend Identification: The first step is to identify the trend using Heikin Ashi candles. Look for sequences of candles with consistent colors (either all green for uptrend or all red for downtrend). This indicates the direction of the trend.
Entry Points: Once the trend is identified, look for entry points. In an uptrend, you might look for pullbacks where the Heikin Ashi candles temporarily turn red before resuming their green color. These pullbacks can be potential entry points to go long (buy). In a downtrend, look for rallies where the Heikin Ashi candles turn green temporarily before continuing the downtrend. These rallies can be entry points to go short (sell).
Confirmation: It's important to confirm entry signals with other indicators or price action patterns. For example, you could use moving averages, support and resistance levels, or oscillators to confirm the strength of the trend and the entry signal.
Risk Management: Set stop-loss orders to manage risk. You can place stop-loss orders below the recent swing low in an uptrend (for long positions) and above the recent swing high in a downtrend (for short positions).
Download Indicator
Here's a simple Heikin Ashi strategy that traders often use:
Trend Identification: The first step is to identify the trend using Heikin Ashi candles. Look for sequences of candles with consistent colors (either all green for uptrend or all red for downtrend). This indicates the direction of the trend.
Entry Points: Once the trend is identified, look for entry points. In an uptrend, you might look for pullbacks where the Heikin Ashi candles temporarily turn red before resuming their green color. These pullbacks can be potential entry points to go long (buy). In a downtrend, look for rallies where the Heikin Ashi candles turn green temporarily before continuing the downtrend. These rallies can be entry points to go short (sell).
Confirmation: It's important to confirm entry signals with other indicators or price action patterns. For example, you could use moving averages, support and resistance levels, or oscillators to confirm the strength of the trend and the entry signal.
Attached Image (click to enlarge)
Risk Management: Set stop-loss orders to manage risk. You can place stop-loss orders below the recent swing low in an uptrend (for long positions) and above the recent swing high in a downtrend (for short positions).
Download Indicator