Just my personal journal to keep my experiments:
Rules: Don't post coding requests here, as I'm only motivated to do what I like ...Most likely I won't be responding to such posts.
Experiment 1: Fractal Dashboard to track indices. Idea from here:
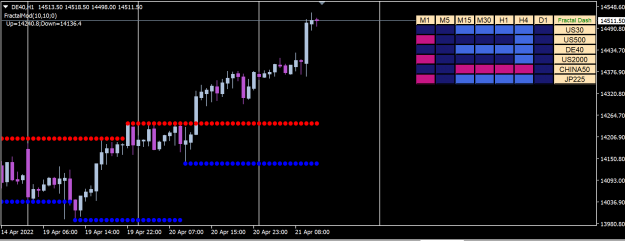
Original idea was to display Trend Up or Trend Down when price breaks out of fractal high or fractal low by a price difference defined by dis_hilo. That's the default setting for this dashboard. An alternative setting can be set to use ATR distance instead when price breaks out of fractal high or low.
a) Using dis_hilo
Trend Up: Close Price > Fractal Up + disHiLo
Trend Down: Close Price < Fractal Down - disHiLo
b) Using ATR (by setting input parameter UseATR=true)
Trend Up: Close Price > Fractal Up + atr_factor*ATR
Trend Down: Close Price < Fractal Down - atr_factor*ATR
There's a button "Fractal Dash" to toggle on/off for this dashboard. And this is a standalone dashboard that doesn't need to call an external indicator.
One thing to note: Because fractals requires enough history bars to calculate accurately, so you cannot display too many symbols. If you want dashboard to display from M1 to D1 timeframes, most likely you could only display up to 10 symbols in the dashboard so that your MT4 will not hang.
There's a passcode to enter in the input parameter for this dashboard-
Passcode: eess_experiments
Rules: Don't post coding requests here, as I'm only motivated to do what I like
Experiment 1: Fractal Dashboard to track indices. Idea from here:
DislikedHi, Can anyone please help me to modify my FractalsMod indicator? Initialy, it only can display fractal up and down. I need to modify it so that if price move higher than my fractal up a value (we call dis_hilo), it display Trend UP. Similarly, when price move lower than my fractal down a value, it display Trend DOWN. I also attach here a free dashboard. I hope that someone could display more indices and timeframe like my image I upload here. Many thanks! {image} {file} {file}Ignored
Attached Image (click to enlarge)
Original idea was to display Trend Up or Trend Down when price breaks out of fractal high or fractal low by a price difference defined by dis_hilo. That's the default setting for this dashboard. An alternative setting can be set to use ATR distance instead when price breaks out of fractal high or low.
a) Using dis_hilo
Trend Up: Close Price > Fractal Up + disHiLo
Trend Down: Close Price < Fractal Down - disHiLo
b) Using ATR (by setting input parameter UseATR=true)
Trend Up: Close Price > Fractal Up + atr_factor*ATR
Trend Down: Close Price < Fractal Down - atr_factor*ATR
There's a button "Fractal Dash" to toggle on/off for this dashboard. And this is a standalone dashboard that doesn't need to call an external indicator.
One thing to note: Because fractals requires enough history bars to calculate accurately, so you cannot display too many symbols. If you want dashboard to display from M1 to D1 timeframes, most likely you could only display up to 10 symbols in the dashboard so that your MT4 will not hang.
There's a passcode to enter in the input parameter for this dashboard-
Passcode: eess_experiments
Attached File(s)