So I've just been cycling through some ideas here and there and looking through some of my daily charts. One thing that keeps popping out at me more and more about this US equity rally is the hidden divergence I'm seeing with rsi and macd momentum indicators. Now I'm not one to usually to follow these for my basic analysis, but the last leg down caused some concern in this rally.
Let's look at some charts I am talking about, I look at ETFs primarily since it's what I use day to day part from FX.
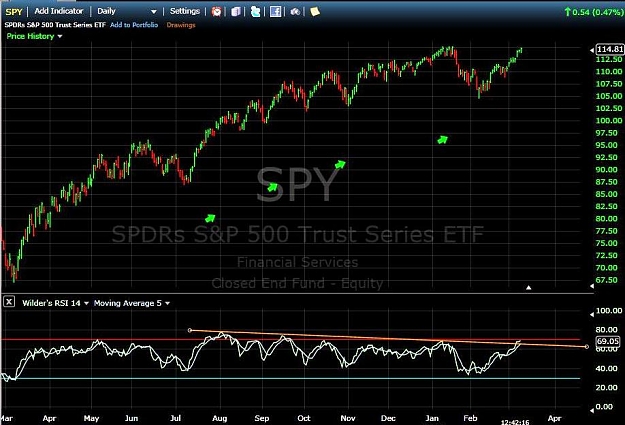
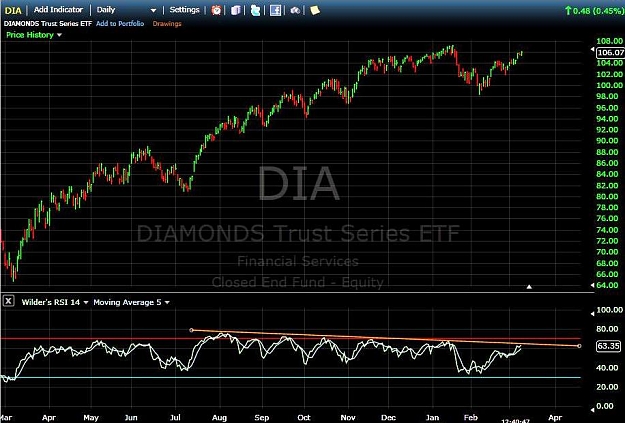
Long Equities S&P ETF and Dow Trust ETF
We can see the trends have obviously been upwards, but volumes since march lows have been decreasing. At the start of this is when many investors jumped in believing it was near the bottom. As a result momentum has been fading and fading with lower peaks of the RSI (MACD looks almost identical).
Now as a rule, hidden divergence should indicate a sell-off coming up in the medium to long-term outlook. While I keep seeing this, I make the connection with the option-arm and alt-a loan predicted issues in the US that are supposed to start showing up later this year as rates start resetting. Also, the rally has not really been supported by many fundamentals this year. But those are just side notes.
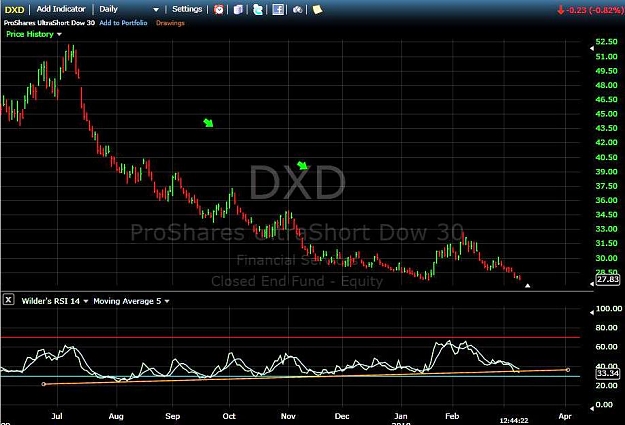
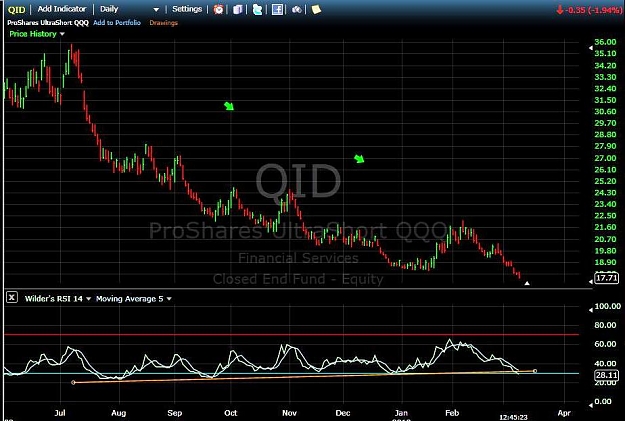
Now we take a look into Short equity ETFs: DXD which is ultra Dow and QID ultrashort QQQ.
In both of these, we see a mirror image of the top two charts with hidden upward divergence with higher lows of the RSI and lower lows on the prices indicating the same thing as before.
{EDIT} I forgot to add anything about a lot of cash being on the sidelines still, and the RSI divergence being rather shallow so theres some food for thought {EDIT}
I know here at FF we usually discuss lower TF opportunities but having an outlook on longer term trends may help here and there.
What do you guys think?
Jonas
Let's look at some charts I am talking about, I look at ETFs primarily since it's what I use day to day part from FX.
Long Equities S&P ETF and Dow Trust ETF
We can see the trends have obviously been upwards, but volumes since march lows have been decreasing. At the start of this is when many investors jumped in believing it was near the bottom. As a result momentum has been fading and fading with lower peaks of the RSI (MACD looks almost identical).
Now as a rule, hidden divergence should indicate a sell-off coming up in the medium to long-term outlook. While I keep seeing this, I make the connection with the option-arm and alt-a loan predicted issues in the US that are supposed to start showing up later this year as rates start resetting. Also, the rally has not really been supported by many fundamentals this year. But those are just side notes.
Attached Image (click to enlarge)
Attached Image (click to enlarge)
Now we take a look into Short equity ETFs: DXD which is ultra Dow and QID ultrashort QQQ.
In both of these, we see a mirror image of the top two charts with hidden upward divergence with higher lows of the RSI and lower lows on the prices indicating the same thing as before.
Attached Image (click to enlarge)
Attached Image (click to enlarge)
{EDIT} I forgot to add anything about a lot of cash being on the sidelines still, and the RSI divergence being rather shallow so theres some food for thought {EDIT}
I know here at FF we usually discuss lower TF opportunities but having an outlook on longer term trends may help here and there.
What do you guys think?
Jonas