I'm no programmer, but I have a simple strategy that I would like to back test.
TF: Daily
Currency: Any
Indicators: 26 EMA & FRACTALS
If PA is above the EMA we will only long. If PA is below the EMA we will only short.
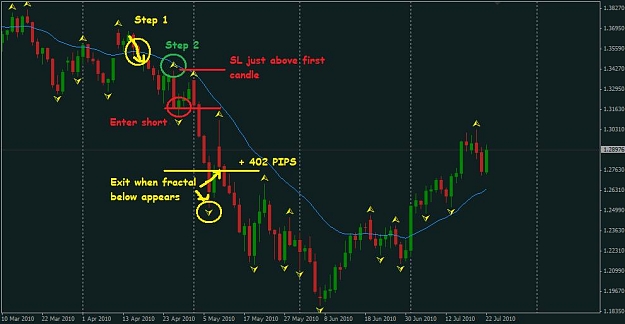
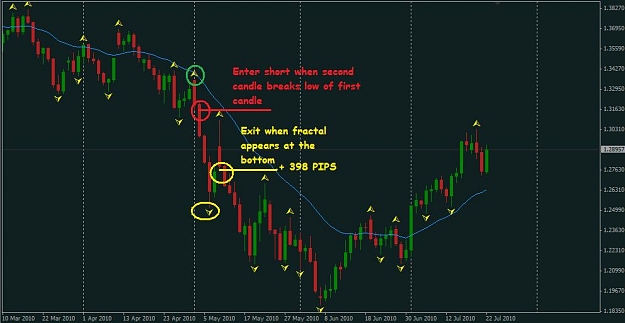
Entry (long): If PA goes through the EMA we will wait for a retracement back to the EMA and then when the fractal appears at the bottom of the reversal candle and the PA is still above the EMA, we will wait for the second candle to break the first candle high and enter long.
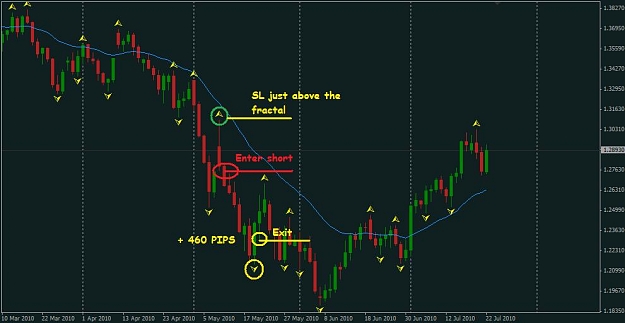
Exit: When a fractal appears at the top.
SL: Just below the bottom fractal.
Examples:
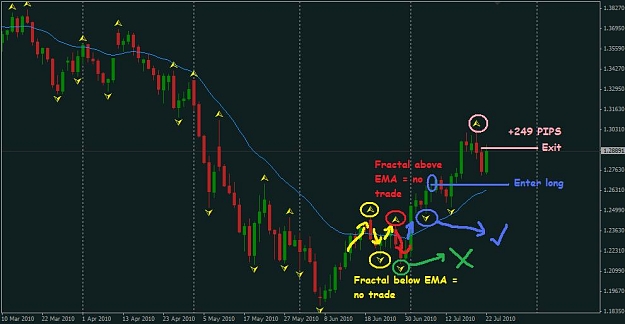
From these examples we would have taken +- 2154 PIPS from 20 April up to today with no loss...
I have manually gone through charts and it looks good. But I would like to back test this.
Can someone help.
Thanks.
TF: Daily
Currency: Any
Indicators: 26 EMA & FRACTALS
If PA is above the EMA we will only long. If PA is below the EMA we will only short.
Entry (long): If PA goes through the EMA we will wait for a retracement back to the EMA and then when the fractal appears at the bottom of the reversal candle and the PA is still above the EMA, we will wait for the second candle to break the first candle high and enter long.
Exit: When a fractal appears at the top.
SL: Just below the bottom fractal.
Examples:
Attached Image (click to enlarge)
Attached Image (click to enlarge)
Attached Image (click to enlarge)
Attached Image (click to enlarge)
From these examples we would have taken +- 2154 PIPS from 20 April up to today with no loss...
I have manually gone through charts and it looks good. But I would like to back test this.
Can someone help.
Thanks.