I have always believed that Supports and Resistances can provide good methods of trading:
Buy a bounce from a Support line.
Sell a Failure from a Resistance line.
Sell if a Support is broken
Buy if a Resistance is broken
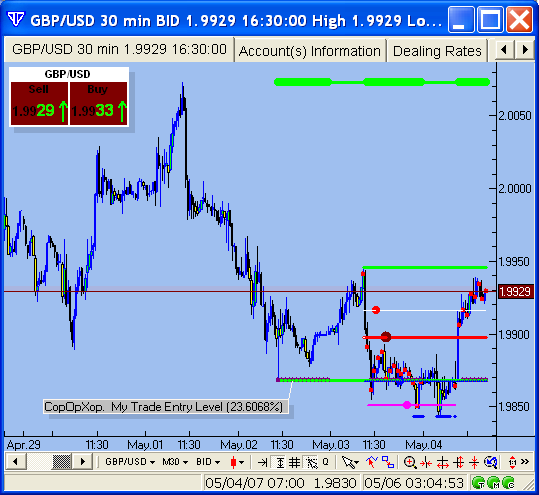
But I dont know where these lines are. I usually open up FXCM platform and read the commentaries as well as the Trades they took. Sometimes, they would explain where the support and resistances are and true enough, these hold. For example. FXCM is short GBPUSD @ 1.9930 and they have their Stops at 1.9950 where they think is the current Resistance level is. This had held last friday inspite of a USD negative NFP (albeit not very USD negative). But how is FOMC and BOE rate decisions going to affect the Support/Resistances? Seems that its bullish GBPUSD with these in consideration.
Some suggests using MA lines... 89 EMA? 40 EMA? And on what timeframe?
Some suggests FIB lines drawn from the highest and the lowest price of the rally. They even use this to determine the trend - if a trend is broken or not.
Im currently studying a trading system based on S/R, Triple Screen Methodoloy and Trend lines (for forex, do we look at Daily? H4? or even Weekly chart to draw the trend?)
I appreciate if you could provide your insights
Buy a bounce from a Support line.
Sell a Failure from a Resistance line.
Sell if a Support is broken
Buy if a Resistance is broken
But I dont know where these lines are. I usually open up FXCM platform and read the commentaries as well as the Trades they took. Sometimes, they would explain where the support and resistances are and true enough, these hold. For example. FXCM is short GBPUSD @ 1.9930 and they have their Stops at 1.9950 where they think is the current Resistance level is. This had held last friday inspite of a USD negative NFP (albeit not very USD negative). But how is FOMC and BOE rate decisions going to affect the Support/Resistances? Seems that its bullish GBPUSD with these in consideration.
Some suggests using MA lines... 89 EMA? 40 EMA? And on what timeframe?
Some suggests FIB lines drawn from the highest and the lowest price of the rally. They even use this to determine the trend - if a trend is broken or not.
Im currently studying a trading system based on S/R, Triple Screen Methodoloy and Trend lines (for forex, do we look at Daily? H4? or even Weekly chart to draw the trend?)
I appreciate if you could provide your insights