![]() ► #Financial #Markets #Observatory #Lab. ◀
► #Financial #Markets #Observatory #Lab. ◀![]()
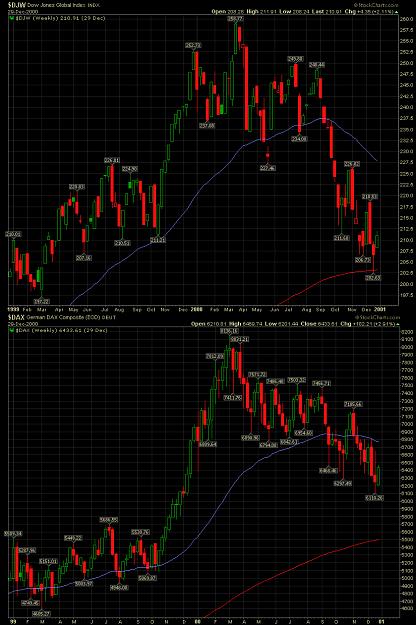
Notes and charts about some ETF Benchmarks on stock markets [IOO, VT, ITOT, OEF, FEZ, EZU].
☒ Aim of the post.
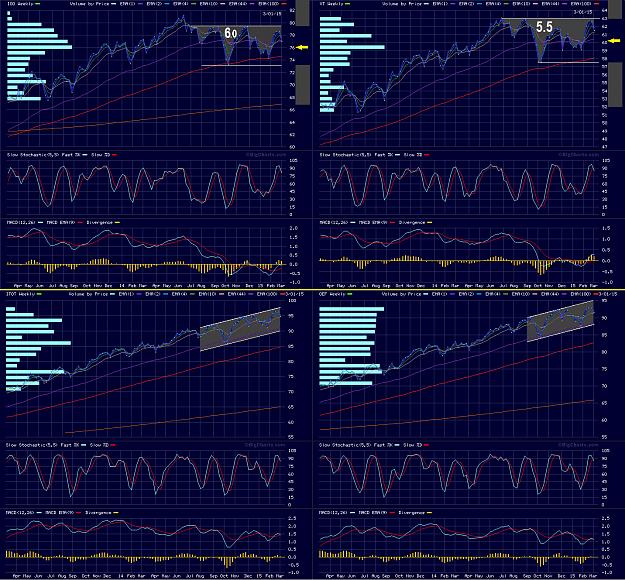
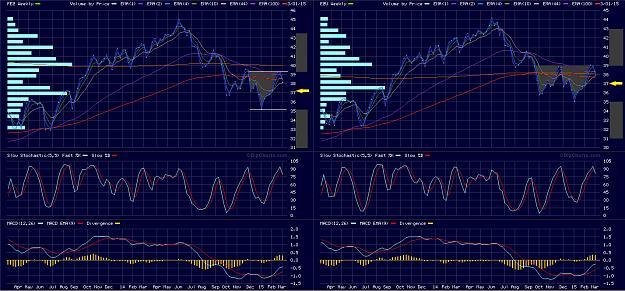
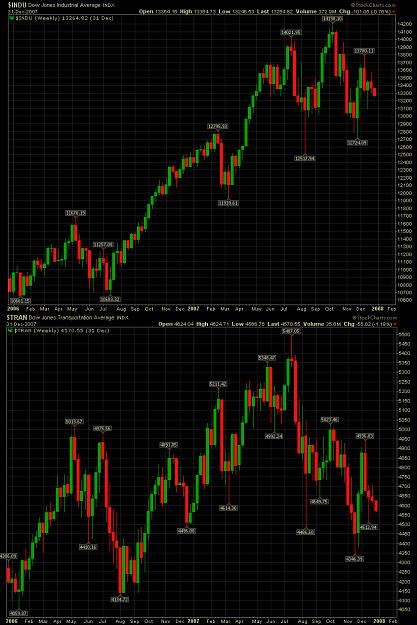
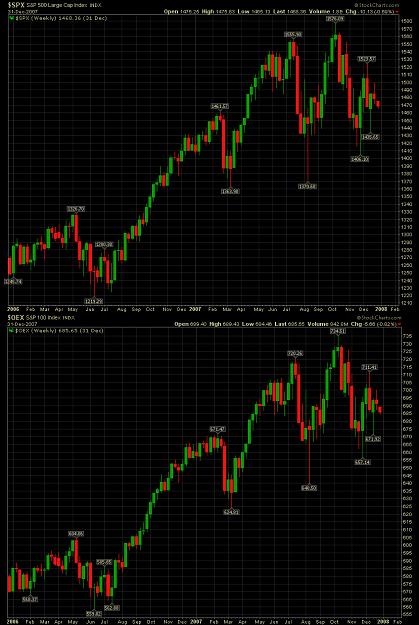
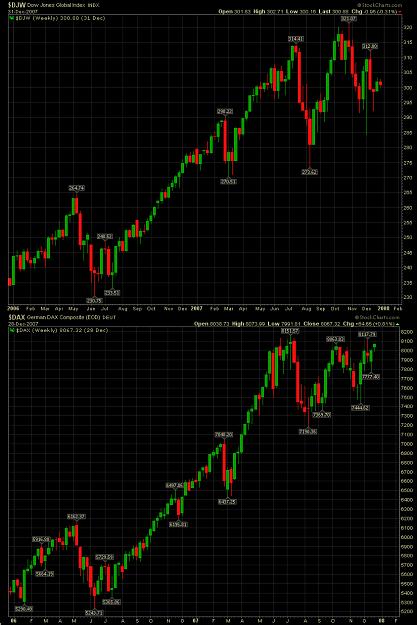
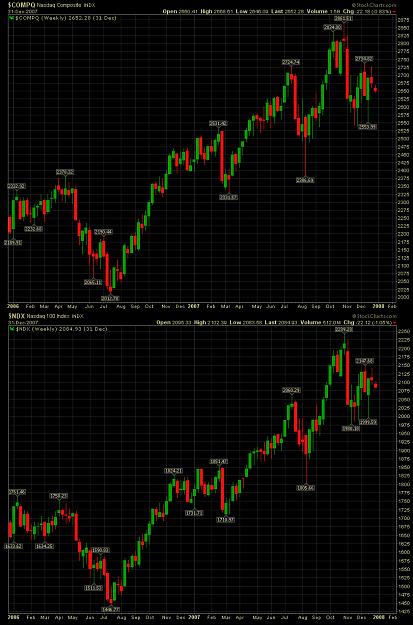
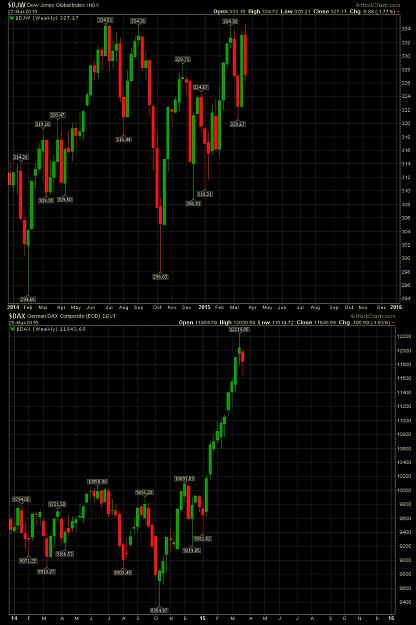
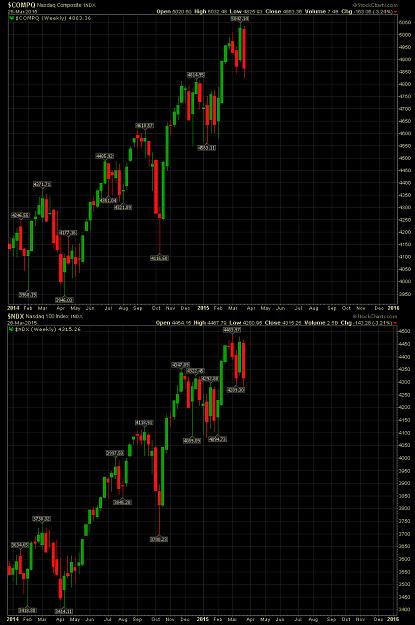
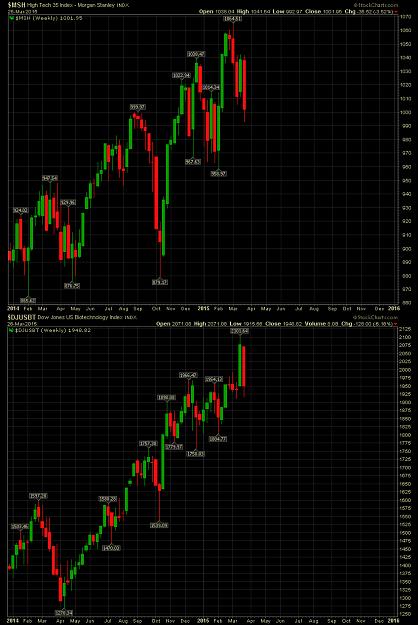
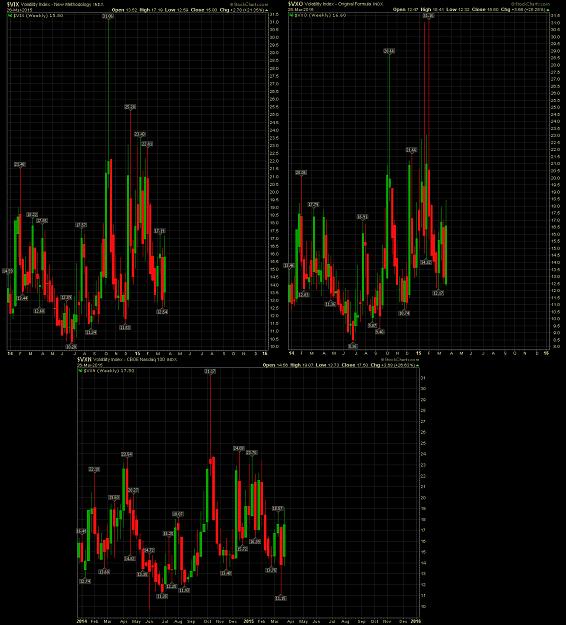
In this post there is a comparation of the chart shapes of the last 8 months, for the following stock benchmarks (as ETF): IOO, VT (global); ITOT, OEF (USA); FEZ, EZU (EuroZone).
☒ General stocks-benchmarks usefull for this post.
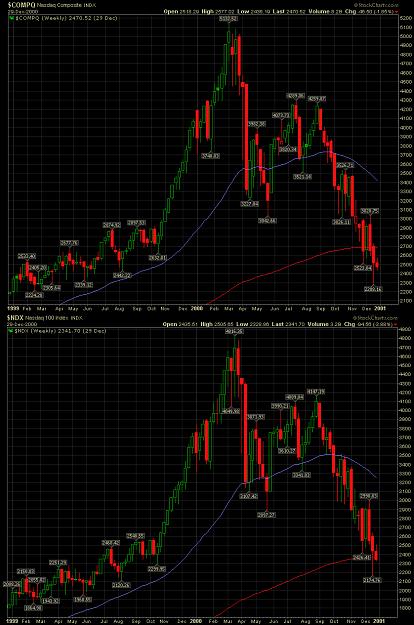
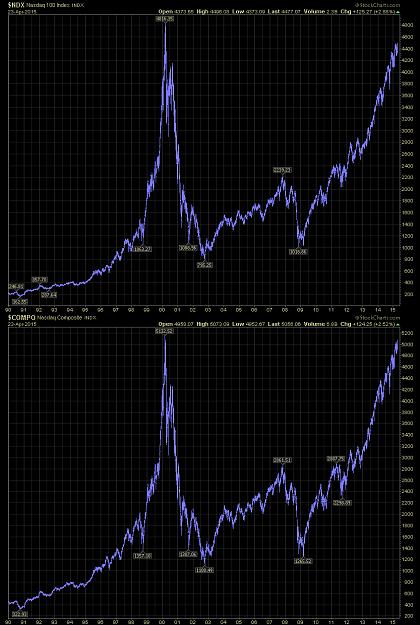
► main U.S. stocks-benchmarks (charts & notes: QQQ; ONEQ; DIA; OEF; SPY);
► global U.S. stocks-benchmarks (charts & notes: EUSA; ITOT; IWB; IWV; IYY; THRK);
► global World stocks-benchmarks (charts & notes: ACWI; DGT; IOO; NYSE W.L.I.; ONEF; VT).
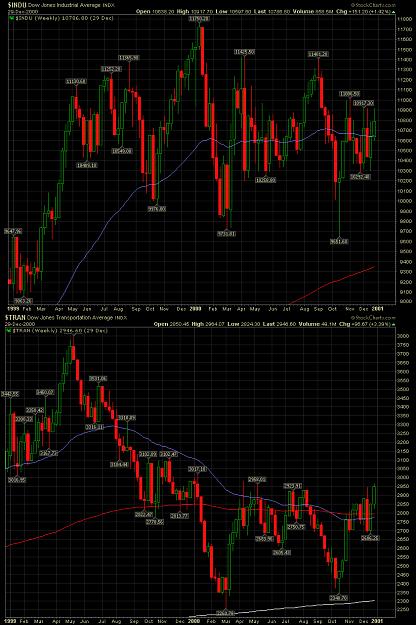
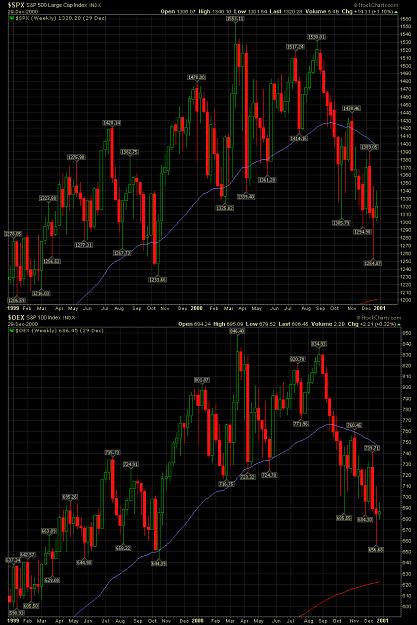
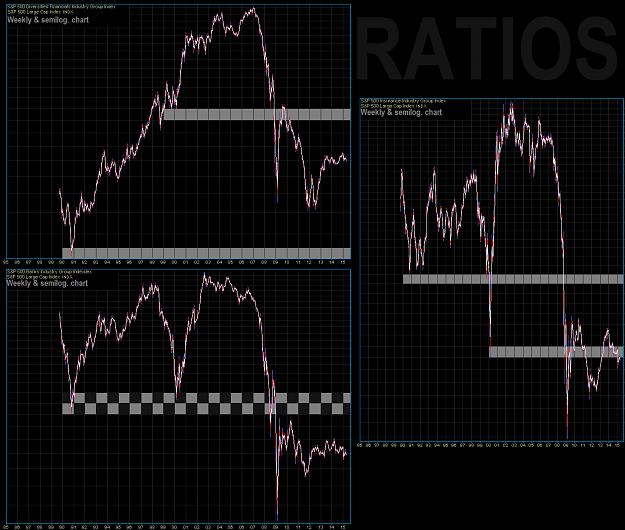
☒ Main graphical elements.
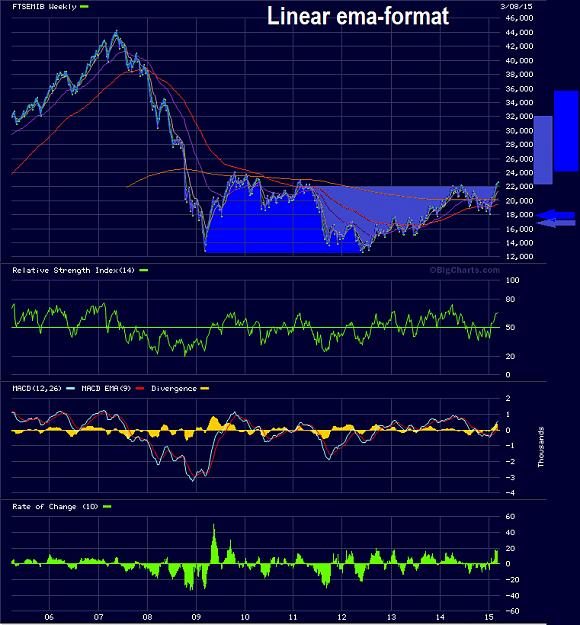
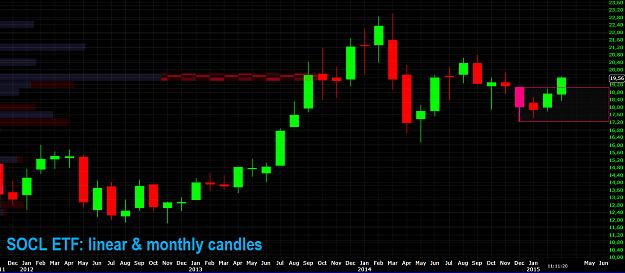
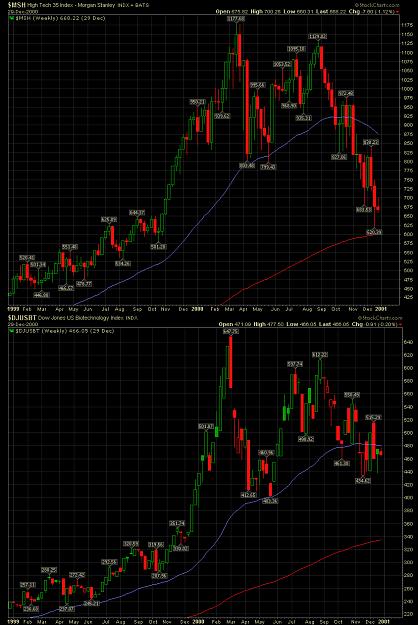
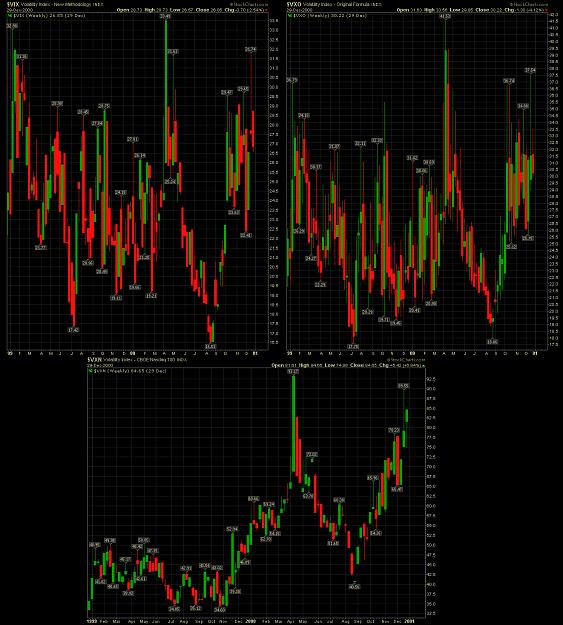
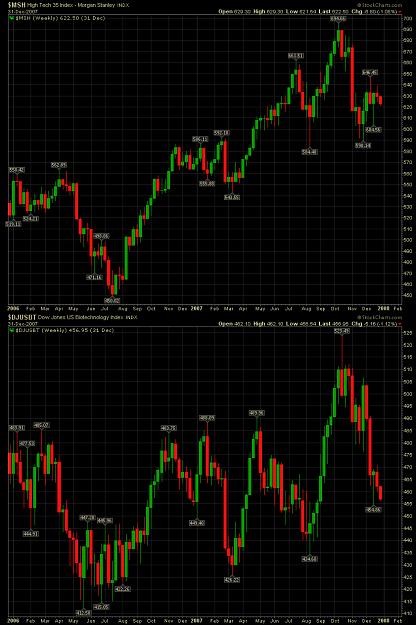
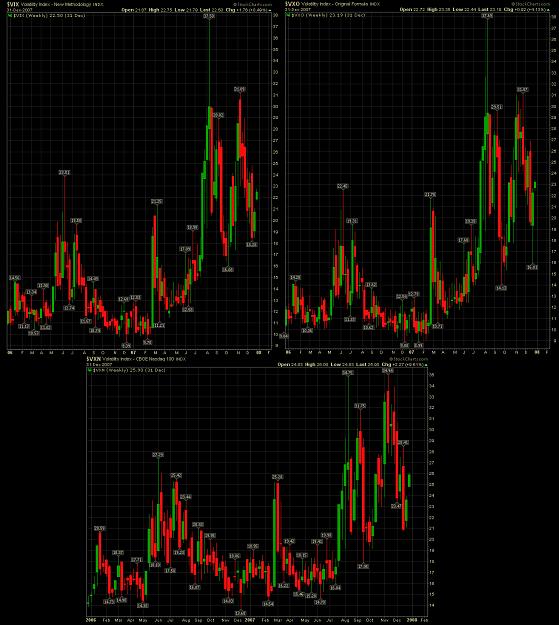
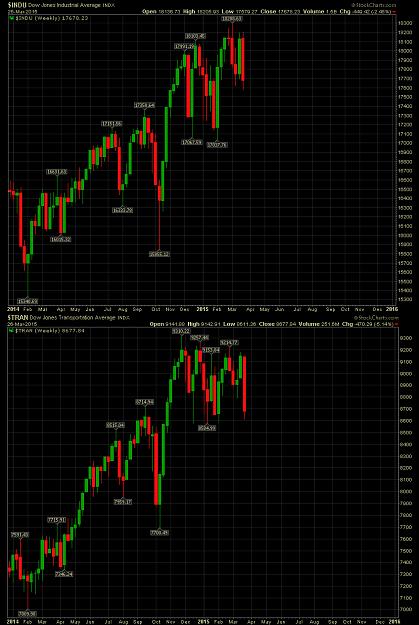
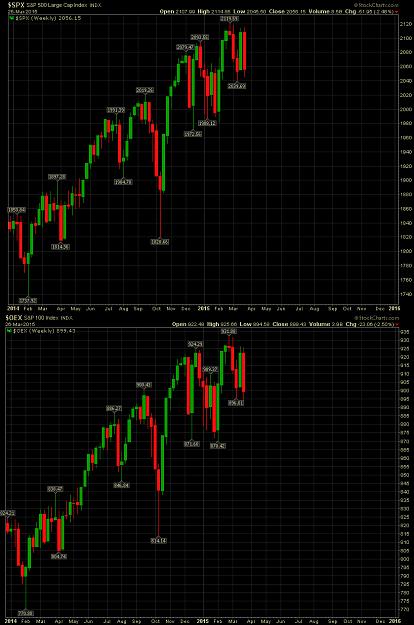
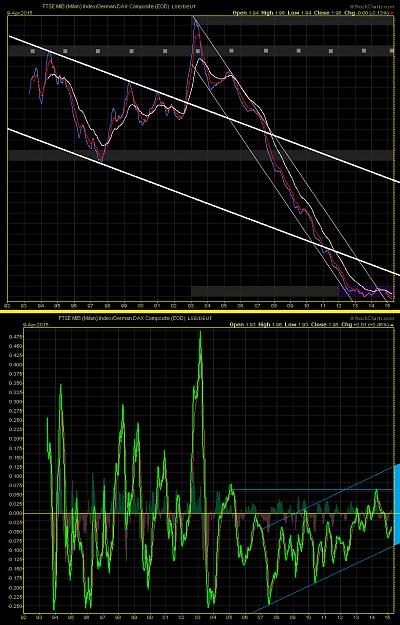
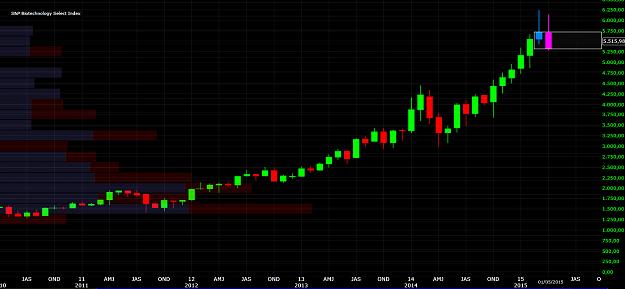
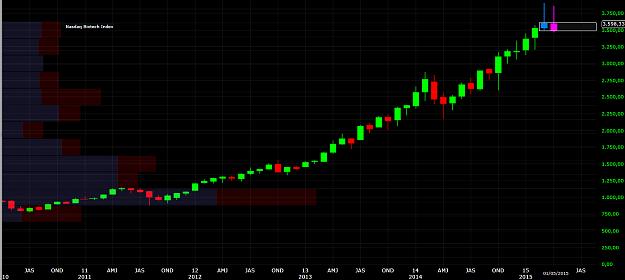
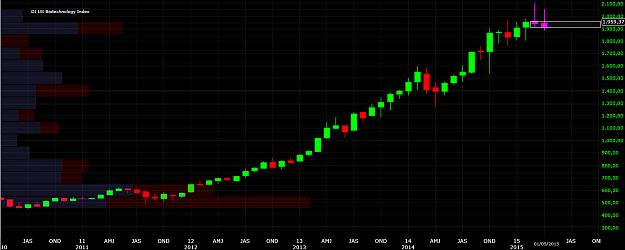
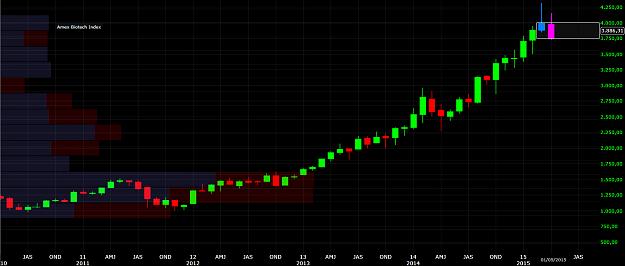
Main graphical elements are on the charts. Charts are in linear and weekly (2-years) ema-format.
Local critical areas are in gray, with possibles up & down targets as gray columns on price-sides. Yellow markers are the 50% levels of their areas (point of switches).
Interesting elements of differences among ETF used, are as follows:
-) spread between ema/1 vs. ema/44;
-) slope of gray area;
-) MACD position vs. zero-line.
☒ References.
☒ Chart sources.
❖ BigCharts.
☒ Sorry for my bad English. I hope that this post is at least minimally useful [Contact].
Tuned on main trend, but follows short-medium term signs from underlying prices, for a correct & real-time set-up.
It is very important do not anticipate the main trend of the underlying financial instruments.
☻/♪ ❖ EARTH.pk, Alert 2.O !!! ❖
/▌
/|
I.M.O. by Sa!Vi ►►♥█║▌│││█║℠║▌║▌▌║█❤◀◀
#KSaddhaPhPKamp: #BundaBunda MPR ❣!!!❣
Attached Image(s) (click to enlarge)