in order to expedite, why not from tomorrow onward, we all compare support and resistance lines D1 (in red), H4 (in blue), H1 (in green), as this is the most important. put up a chart for D1 or H4 or H1 in the pairs that you are interested in. I am hoping that more will join in to learn from each other.
Ignored
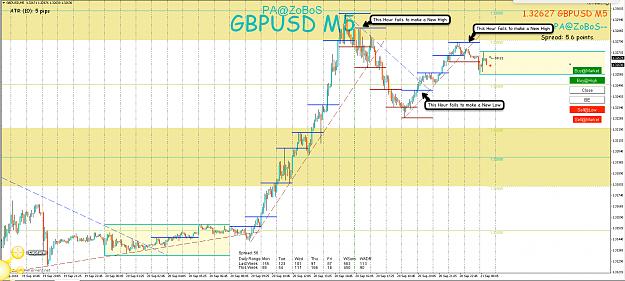
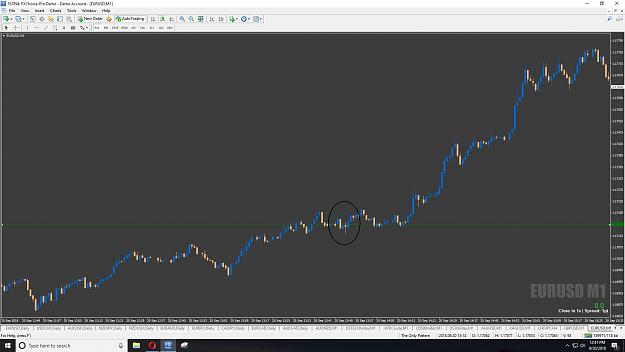
Ok check this out please. Hourly support drawn to trade on m1 chart. The additional chart is the entry I would have looked for today off this s/r level since price action was bullish from open????
in order to expedite, why not from tomorrow onward, we all compare support and resistance lines D1 (in red), H4 (in blue), H1 (in green), as this is the most important. put up a chart for D1 or H4 or H1 in the pairs that you are interested in. I am hoping that more will join in to learn from each other.
Ok, guys, I am now confused about S/R lines. At first, there was a grid, follow a candle with a long wick, if its reversed, the mark the furthest grid-line as the S or R line. Then, there was a notion to mark the extremes of the previous day at the tails or shadows of candles which are turning points. Is there a simple outline how to mark S/R levels that people can follow? Wink-wink @ inthebox
I read and saved to my notes this,
"levels 10 pips apart are drawn at tails or shadows of candles which are also turning points. lines at least passing through 2 or 3 candles."
and this,
"this is not for newbies, I am going to explain how I make my m1 (m5/m15) entries for those who are interested.
1. first and foremost and most important draw your d1 (or h4 or h1) support and resistance.
trade around these zones and not all over the place.
2. around the zone, be an observer and see what m1 (m5/m15) is doing. be patient and do not force a trade.
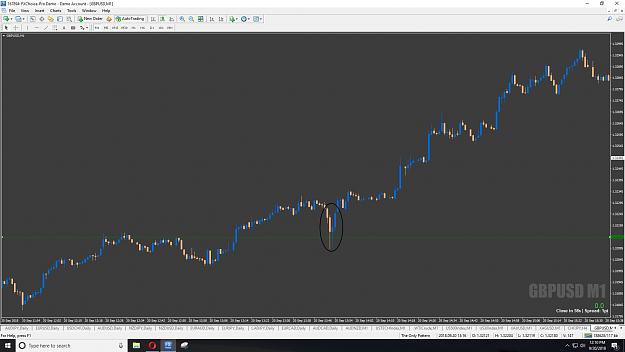
3. if at support zone, look for price higher high as in today's usdjpy m1 chart shown.
4. I have 2 types of m1 entries: a) head and shoulder in yellow, b) 2b in red. if you do not know please google. I will not explain.
5. first head n shoulder yellow horizontal line entry not triggered (no right shoulder). first 2b red horizontal line entry triggered.
6. second head n shoulder yellow horizontal line entry triggered. second 2b red horizontal line entry triggered.
7. 2b entry got into the trade earlier but more risky. "
in order to expedite, why not from tomorrow onward, we all compare support and resistance lines D1 (in red), H4 (in blue), H1 (in green), as this is the most important. put up a chart for D1 or H4 or H1 in the pairs that you are interested in. I am hoping that more will join in to learn from each other.
Ignored
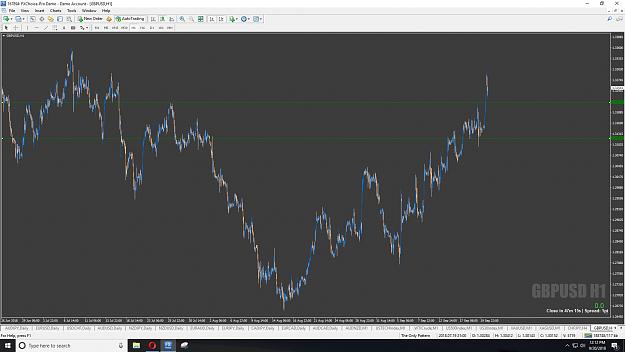
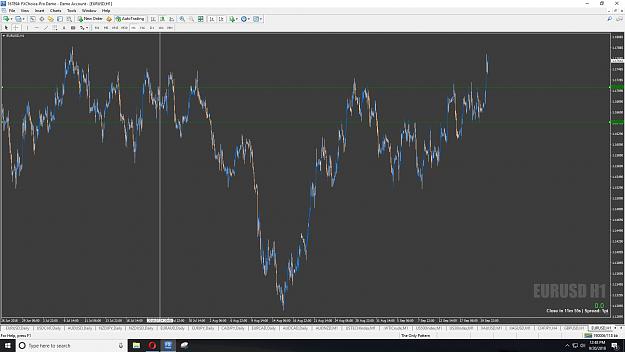
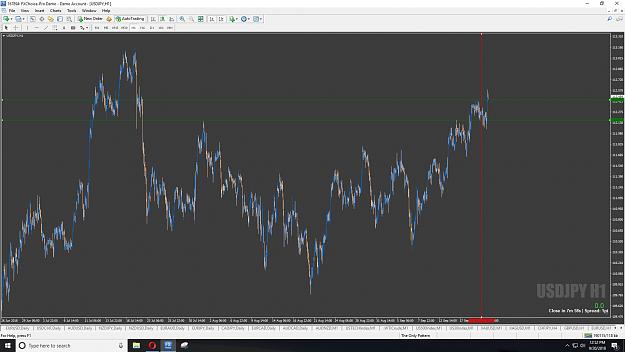
And UJ. I would have been looking long as this was the hourly trend but I honestly would have been stopped out several times unless my target was < 5pips. There were valid setups just going off the 2 s/r lines and using "the only pattern".
in order to expedite, why not from tomorrow onward, we all compare support and resistance lines D1 (in red), H4 (in blue), H1 (in green), as this is the most important. put up a chart for D1 or H4 or H1 in the pairs that you are interested in. I am hoping that more will join in to learn from each other.
My method is to find S/R at whole number and that is to say numbers ending with 10s..........10,20,30,40,50,60,70,80,90,100...........so on...........and that is why we have the grid to make it clear to our eyes.........that will fit all time frames from 1H to monthly...............as for the lower time frames like 1M 1pip is our grid.........watch the reaction of candles wicks to those lines and hence S/R............
for analysis start marking R/S at the daily..........mostly it will suffice .............but if you want to trade lower time frames for targets less than 50 pips then you have to mark lower time frames like 4H and 1H surely those marks will go in between the daily S/R..........
For entry watch lower TF for OP to get in the trade around those levels.......
Every day you trade you will get more experience............and once you start to do the same thing over and over again you will master it..............it is a profession no matter how it looks simple at the 1st glance..........
My method is to find S/R at whole number and that is to say numbers ending with 10s..........10,20,30,40,50,60,70,80,90,100...........so on...........and that is why we have the grid to make it clear to our eyes.........that will fit all time frames from 1H to monthly...............as for the lower time frames like 1M 1pip is our grid.........watch the reaction of candles wicks to those lines and hence S/R............ for analysis start marking R/S at the daily..........mostly it will suffice .............but if you want to trade lower time frames...
Ignored
Hi Atheer1,
could you plz upload a latest screen shot supporting this post.
I am learning your method, that would help me if you could plz.
thanks.
{quote} Hi Atheer1, could you plz upload a latest screen shot supporting this post. I am learning your method, that would help me if you could plz. thanks.
Ignored
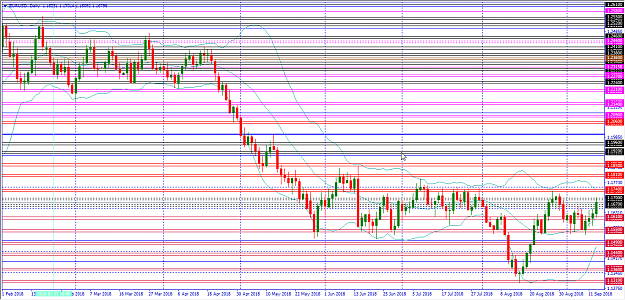
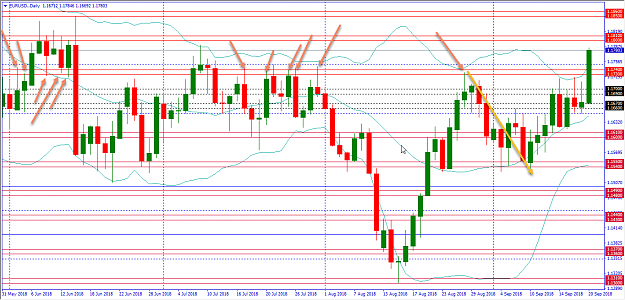
Let us have this chart 1st................
Attached Image (click to enlarge)
where the daily levels are marked
let us concentrate at 1.1730-40 level
see how this level was chosen by just looking at daily highs and lows
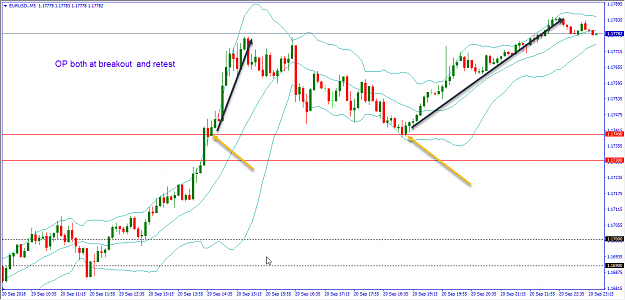
Attached Image (click to enlarge)
let us look at this day opportunity to buy twice from this level with good R/R
Now time for 5M chart
Attached Image (click to enlarge)
Now if you are not marking this level and others here surely you will not notice what happened here
{quote} Hi Reo, Take a look at the chart see if it makes sense... {image}
Ignored
Absolutely. Structure built by hh/hl, lh/ll. What I'm not sure of is how you use this to setup trades other than identifying that an uptrend has changed to a downtrend or vice versa.
{quote} Let us have this chart 1st................ {image} where the daily levels are marked let us concentrate at 1.1730-40 level see how this level was chosen by just looking at daily highs and lows {image} let us look at this day opportunity to buy twice from this level with good R/R Now time for 5M chart {image} Now if you are not marking this level and others here surely you will not notice what happened here