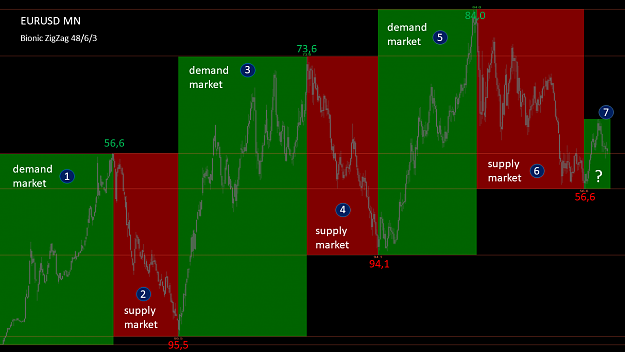
Dislikedthank you Michael for your work and information share . i am working on your chart style . can you tell us , how you are using this chart to find equilibriums ?Ignored
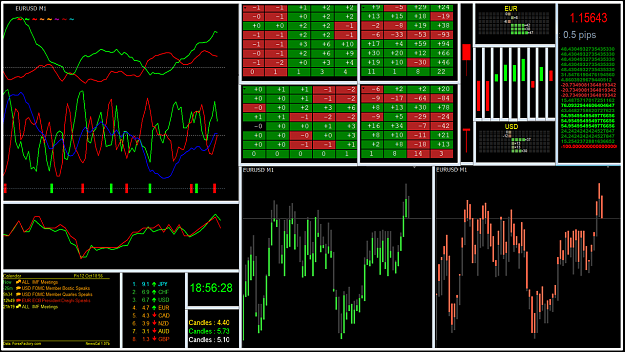
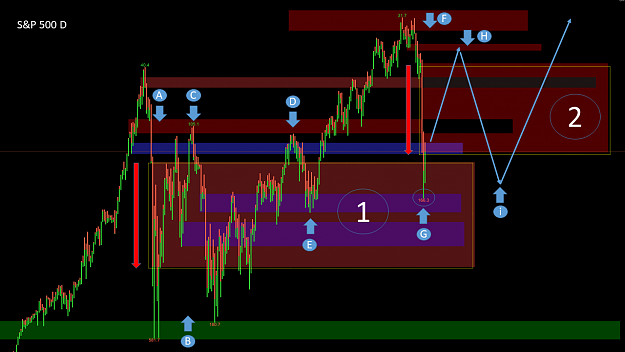
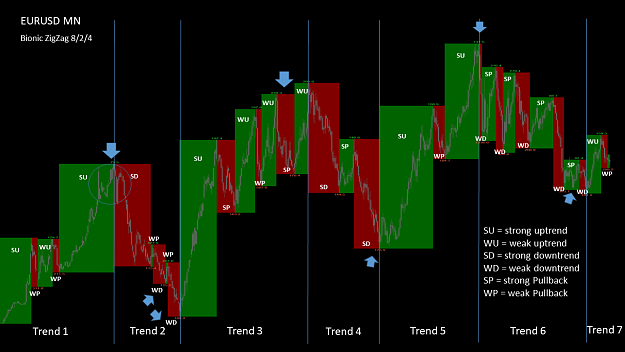
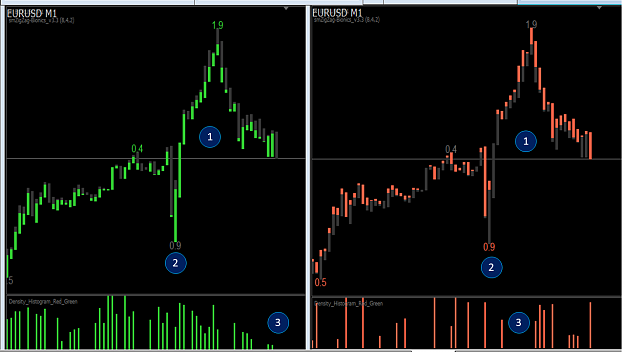
I am pleased that the bionic chart is already very well received, as you know this chart is still relatively new. Of course, I had some time to work with it, but with the background to check if the output values are correct. Of course, within the next two weeks, I will specifically report on supply and demand. The third project is yet to come and should be completed by the end of next week.
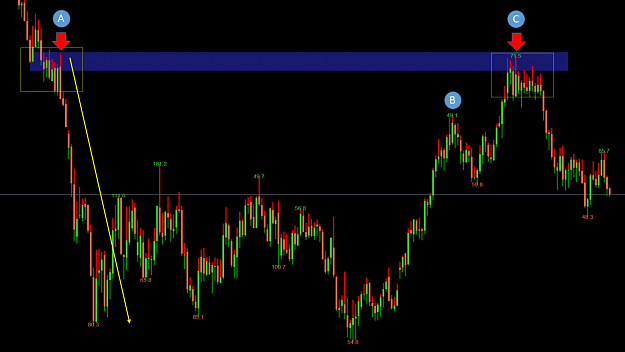
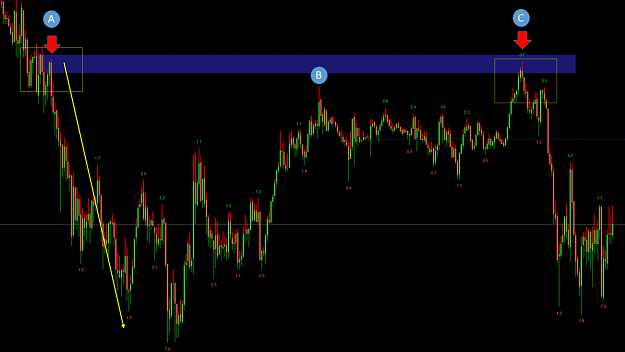
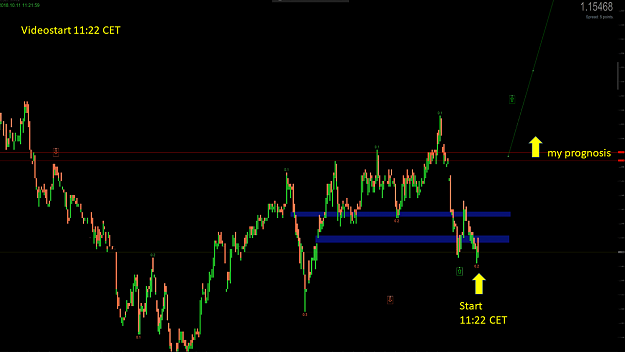
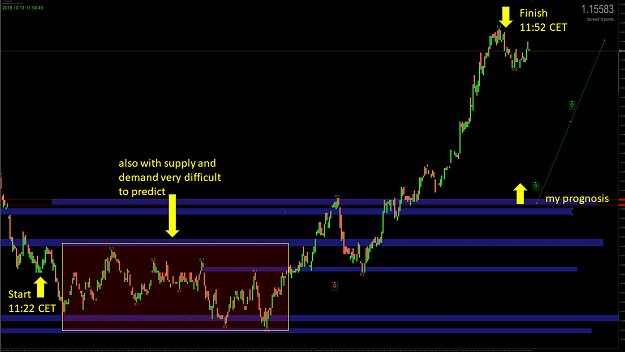
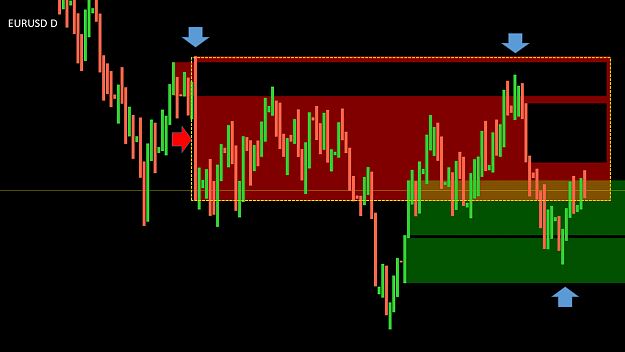
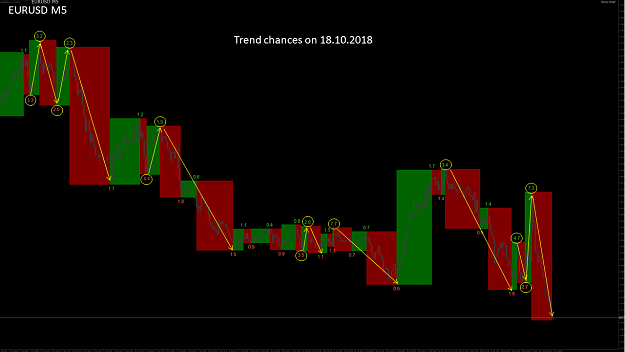
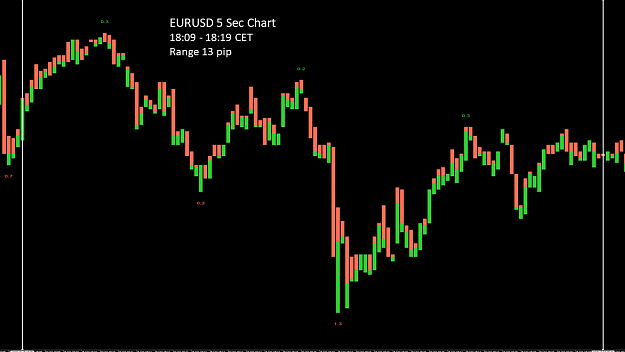
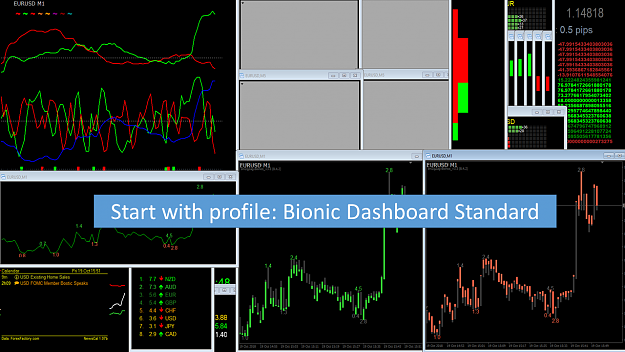
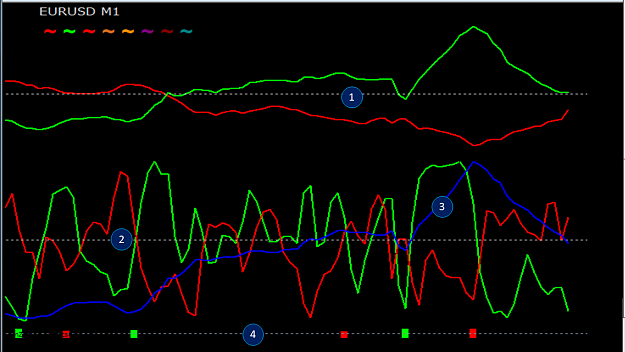
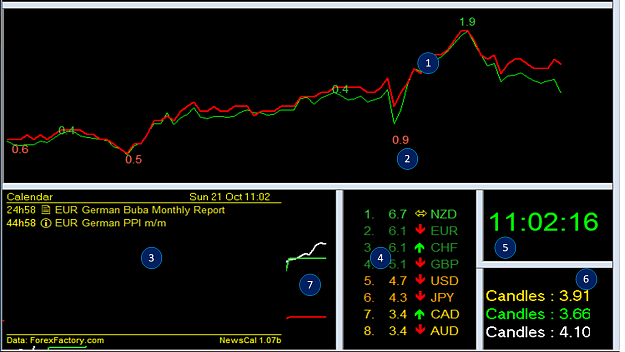
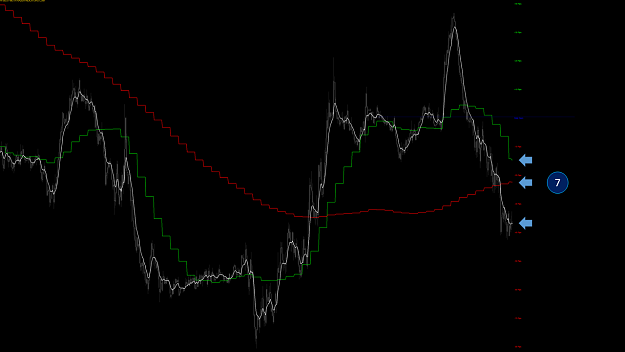
However, I can give you a little hint. If you build a 5 second chart and copy the bionic chart into it you will have 20 candles per minute. Try plotting resistance and support lines using this 5 second chart as I did in my posted video.
Inserted Video
Of course, this will not always work, as there are superior resistance and support lines. That's not dramatic, though, as they get used to the chart faster. In half an hour, you have processed 600 candles. With a 1 minute chart you would need 10 hours for this workout. As I said, it's only time to get a feel for the kind of candles, because such a way of training is a good option. However, you need a 20 times faster response time.
I wish you a lot of success. Greetings
Forget:That does not work, amateurs build the ark, pros the Titanic!
2