Hi AlphaOmega and thanks fort this strategy. What is going to happen if the market make a huge move in one direction and doesn’t come back? With this pyramid system, You will probably have a lot of positions in loss. You can see this condition twice in Your screenshot in the initial post. I think it would be hard to recover from those big losses...
Ignored
I've traded reversion to the mean systems for years and even developed a very robust trading application around the concept years ago. The way to get around long trends is multiple time frames. For example, if trading intraday charts, verify the intraday mean against higher a higher time frame like the 4hr or daily. More often than not, there will be confluence between lines across time frames. IE the mean on the Daily is the +1 or +2 on a 15 min or 30 min. etc.
One of the things that can happen is that the mean can be trending upwards steadily and price will just keep going up at a steady pace hugging the mean. So ideally, you only take trades at the +-1 or beyond in the direction of the overall trend. IE buy at -1 or -2 in an up trend. As tempting as it is to sell +1 or +2 and target the mean in an uptrend, it's risky. So either decrease trade size, or only target the next level such as go from +2 to +1 and keep it tight. Price might not reach the mean. But the mean can catch up to price, if that makes sense.
Hi, and thanks for stopping by! Regardless if you're new or old member of the forum, keep reading here and I promise you will not be disappointed! From my point of view this thread is the natural continuation of the thread "Higher Edge within a Single Candlestick” and here I intend to share with you some of my discoveries regarding this concept. As I commented in the original thread, I believe that we can create and apply multiple strategies only by using the information which is...
Ignored
Dear Alphaomega,
Thankyou for sharing your strategy, I love your concept as I developed and use a similar one that ignores the use of midlines. The position build up is a really clever way to scale into the trade and I am glad it is not martingalily, but linear. Now with the fat-tail days, is the position build up that detrimental that the 60-98% accuracy gains are so impacted?
I am slowly learning to code in mq4, so that I can test my solutions for the fat-tail distribution days. Wish you all the best and happy trading,
Tzamo
"Only you can Make the Future you will be proud to be a part of..." -Me
{quote} I've traded reversion to the mean systems for years and even developed a very robust trading application around the concept years ago. The way to get around long trends is multiple time frames. For example, if trading intraday charts, verify the intraday mean against higher a higher time frame like the 4hr or daily. More often than not, there will be confluence between lines across time frames. IE the mean on the Daily is the +1 or +2 on a 15 min or 30 min. etc. One of the things that can happen is that the mean can be trending upwards steadily...
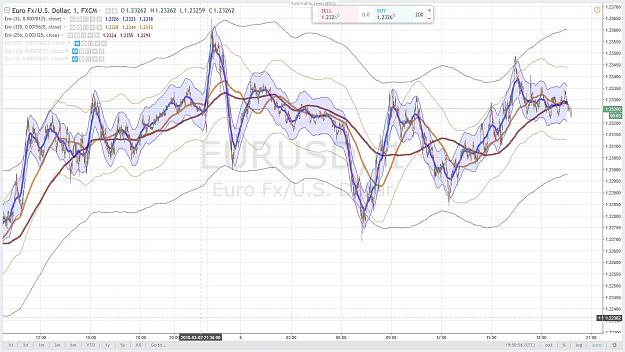
Using a lookback period of 2 days, price was huggin the mean (blue line) in an uptrend. I waited for price to dip to the -1 or lower area and went long when price dipped down to the central pivot which was also the -1. Initial target being the mean area and aggressive target being the +1 which was also a pivot area.
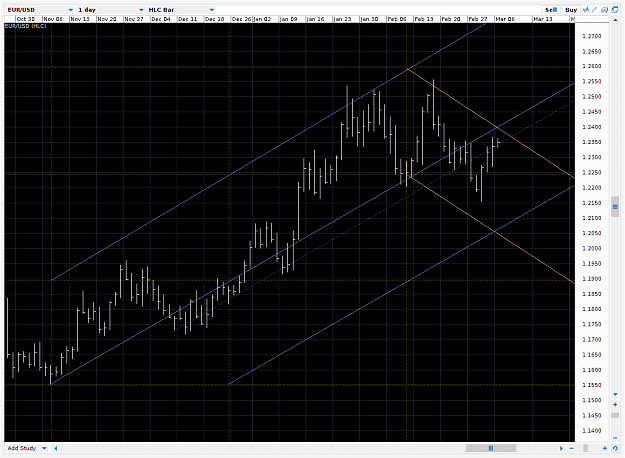
Here's my old application with multiple time frames. The main thing with the old system was channel direction. Below the mean was a buy zone, above a sell zone. So I'd basically look across the numbers on the right and see what the colors were to know what zone price was in across the time frames and go from there. For example red (sell) zones on the daily and 4h, and look for price at the top of 15 min channels for more precise timing. This next screenie shows price coming down off the top on the daily, 4h. When price was at the top of the 1h and 15 in a down channel, that's the sell. All of the numbers on the right look like a mess but once you know what to look for, it would be easy to see the confluence across price levels.
{quote} I've traded reversion to the mean systems for years and even developed a very robust trading application around the concept years ago. The way to get around long trends is multiple time frames. For example, if trading intraday charts, verify the intraday mean against higher a higher time frame like the 4hr or daily. More often than not, there will be confluence between lines across time frames. IE the mean on the Daily is the +1 or +2 on a 15 min or 30 min. etc. One of the things that can happen is that the mean can be trending upwards steadily...
Ignored
Initially I had the same thoughts. But my back-test results show that there is no correlation between higher and smaller time frames. Or in other words, it does not matter if we trade with or against the trend from higher time frames. In fact when we add information from other time frames or from indicators we get very bad results. More "filters" = bad results!
This is very counter-intuitive and initially does not make sense. Right?
But I trust my tests! I don't trust opinions. Not even my own opinion.
That's why in the first post I said that we have to look at each trading cycle as independent event. We don't look at history! We don't look at other time frames. We don't look at indicators.....We don't look at news.
We only take into account the current raw data. High, low, Range, Mid, Time, Current price. That's it! Keep it simple. Nothing else. Maybe only in the second system layer we can use daily ATR values for optimizations. That's all.
In this strategy timing is the most important thing!
We only open new trades in the first part of the trading cycle. The shorter the first part the less risk there is. And we have much smaller chance to get a hit by fat tail because almost all of the fat tails happen during the overlap EU-US.
Once we are past "midnight" on the cycle clock we enter into management/close mode only. This is critical!
The other thing is diversification! VERY important. We have to break and spread the trading volume into many instruments.
The more markets we trade the safer it is. The performance of the system will improve as we increase the number of markets. Ideally we have to trade simultaneously at least 10-15 uncorrelated markets. This way even if we get hit by fat tail on one market the loss is usually compensated by the other markets.
When we trade uncorrelated markets, it is very unlikely to experience big losses on many markets at the same time. The results are balanced at least 99% of the time. This way we get smooth equity curve. Without big fluctuations.
To understand this, You can imagine extreme theoretical example where we can run this system on 1000 uncorrelated markets. This is will be pretty much bulletproof strategy. Almost impossible to lose.
Unfortunately these uncorrelated markets do not exist. And even if they did we still need tens of millions$$ to start.
Let's see if my timing understanding works. It should be time-price unity now.
Attached Image (click to enlarge)
The problem with this, that the price can slowly go up, without 25% retracement, and be with time unity. But at some point the daily range limit will be reached.
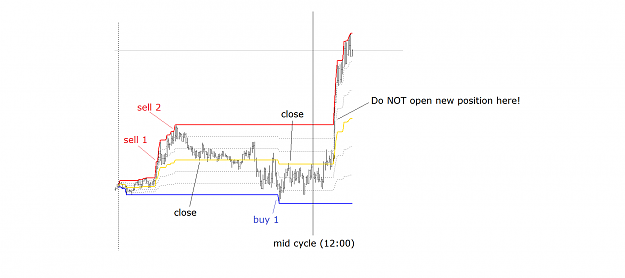
1. Initial signal. (If there is no open position)
We SELL 1 unit when the current price is equal to the highest price for the current cycle AND the current time is below the mid cycle. (In our example before 12:00)
I take it 12:00 is local London time 12:00 pm. If not kindly tell me what is 12:00 in local London time. Love you. thanks and
Regards
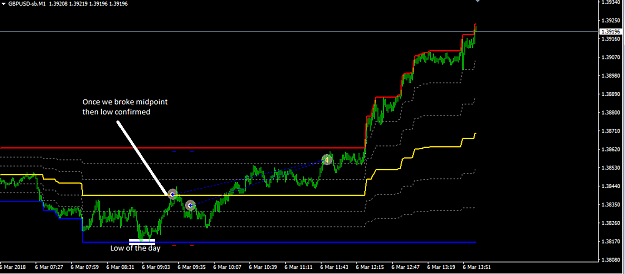
Great thread and thank you for sharing all your hard work. I have been playing with the indicator and remembered a while back, I did some research on when Hi or low of the day is formed and found from LO it’s normally the first few hours. Having gone through your indicator, I can see that if there is a low or hi just after LO and it come back through the midpoint then we can expect the overside to be formed. So, if we have a low after London open then it passes through the midpoint we can expect to see a hi form, most time of the same distance....
Ignored
My trades from this morning, little different but as said before using your cycle indicator to determine either the low or high of the day from Frankfurt, once we break the midpoint and work out today. Took a 1:1 risk reward but as you see we could have got three time that... This is a live example on one way to use your indicator
{quote} n. That's why in the first post I said that we have to look at each trading cycle as independent event. We don't look at history! We don't look at other time frames. We don't look at indicators.....We don't look at news. We only take into account the current raw data. High, low, Range, Mid, Time, Current price. That's it! Keep it simple. .
Ignored
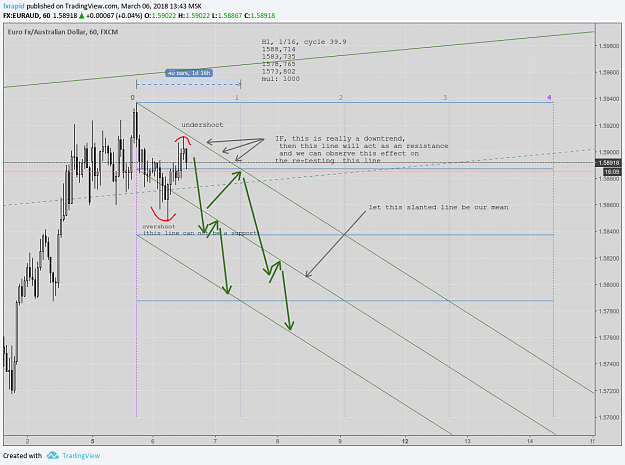
Problem is : each trading cycle is NOT an independent event.
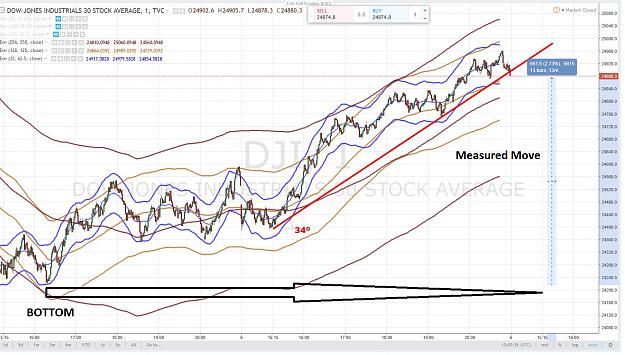
Looking at this example , you can observe the effect of what Jim Hurst calls "the Underlying Trend"
The Underlying Trend is the Sum of all Cycles whose Periods are longer that the period of the observed Cycle
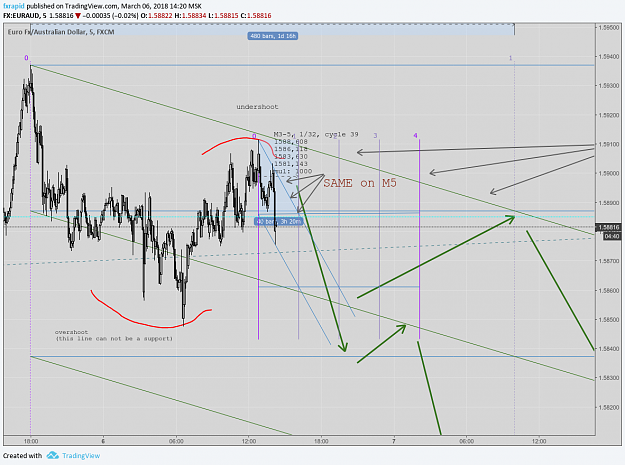
Let's consider the Envelope 32 TU - blue
The Measured Move = The distance in points between the last significant Bottom and the Last Low of The Envelope 32 TU is around 650 points
This represents the effect on Price Action of the Underlying Trend of the Dow (within the parameters)
As the amplitude of the Envelope 32 TU - blue - = 2 x 62,5 = 125 points, we can conclude that the effect of the Underlying Trend Price Action on the UP Trend (+ 650 points) is roughly 5 times more important that the effect of the Envelope 32 TU fluctuations (+ 125 points)
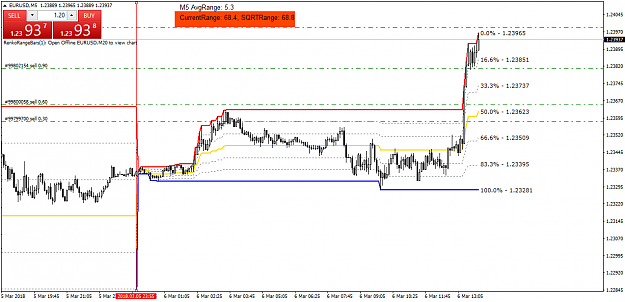
Here you can see example for correct trading using the standard rules with EURUSD price action from this morning: {image}
Ignored
That is just about the same thing I did last night! I got out a bit early but same idea.
Attached Image (click to enlarge)
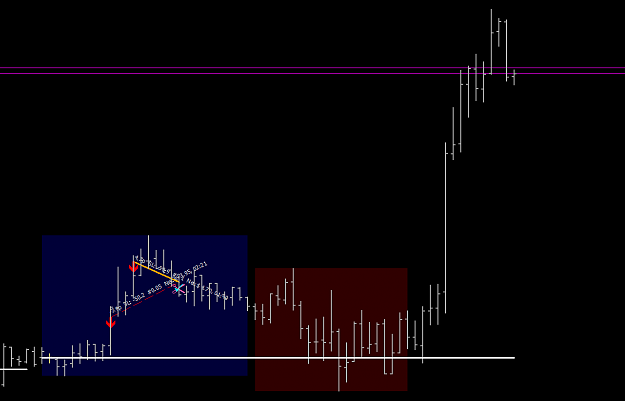
I added the sessions indicator to tell me when its OK to enter (Blue square area) and where I may want to be cautious about entering (maroon square area). Beyond the squares, no new trades will be opened.
Also, the white horizontal line is the daily open line indi. set to start at GMT+2
Hi alphaomega
I might be jumping the gun somewhat here.but using that daily and reducing down in time periods with a simple calculation you are able to determine the extended range and more importantly the price levels at which time and price converge with order clusters .
Maybe you intend to touch on similar with the time sq.
If I'm taking this off track that's fine and will continue as a silent observer with great interest
Regards
{quote} In fact when we add information from other time frames or from indicators we get very bad results. More "filters" = bad results! This is very counter-intuitive and initially does not make sense. Right? But I trust my tests! I don't trust opinions. .
Ignored
Fact is I do no trust your opinion !
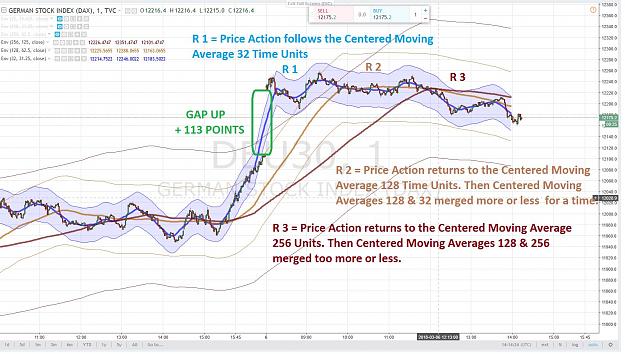
I will not use the EURUSD because as it is traded day and night EURUSD most often FOLLOWS its averages (32, 128 or 256)
I will use the German DAX because it is not traded at night ..... as most indexes, shares, financial instruments.
Does the DAX sleeps at night ? during week-end ? during holydays ? NO
Hence after the close, X hours after the close , at the Open we have a GAP. UP or DOWN
Here we have a GAP UP of + 113 points (night shift effect)
Then Price Action returns to its previous average - Chart is self-explanatory
Not in that chart. I do my Gann stuff quite differently than the tradingfives guys. (I know their stuff well. Been trading Gann almost as long as standard deviation channels)