Looks like the bears have finally got their claws in and aren't letting go this time.
Ignored
So far only a technical move down to SMA100 on the hourly for DJI, situated under the 50 period lower Bollinger band. Let's see what happens after the lunch period.
Dow took the stairs up last night and this morning but has sensibly come back down on the turbo escalator this afternoon. 300 pips so far with only 2 shallow pullbacks and it's looking like a strong impulse wave. If that holds true, then I think this move should extend down to at least the 23870 area (wave 1 Mon & Tues was 512 pips, times that by the Fib ratio 1.618 = 828 pips off this afternoons high at 24698). We'll just have to wait and see.
Dow took the stairs up last night and this morning but has sensibly come back down on the turbo escalator this afternoon. 300 pips so far with only 2 shallow pullbacks and it's looking like a strong impulse wave. If that holds true, then I think this move should extend down to at least the 23870 area (wave 1 Mon & Tues was 512 pips, times that by the Fib ratio 1.618 = 828 pips off this afternoons high at 24698). We'll just have to wait and see.
Ignored
The high today was the upper 50 period Bollinger band on the hourly...
SMA50 was pointing down, and so was the Bollinger band - a natural resistance level. You may want to check action around Boll50 historically. These levels should be watched, in my experience.
{quote} SMA50 was pointing down, and so was the Bollinger band - a natural resistance level. You may want to check action around Boll50 historically. These levels should be watched, in my experience.
Ignored
Thanks for explaining. I've never used Bollinger bands (perhaps I should start!) but I have the SMA50 and LW50 on the 1HR and the 4HR MACD was showing me that yesterday and today's pa was a pullback and not a new impulse wave. I had 26455 - just above the 76.4 fib - as the top of this mornings pullback, but once that broke I figured a kiss on the underside of the trendline support going back to Dec 26th was on the cards - and so it proved to be.
{quote} Thanks for explaining. I've never used Bollinger bands (perhaps I should start!) but I have the SMA50 and LW50 on the 1HR and the 4HR MACD was showing me that yesterday and today's pa was a pullback and not a new impulse wave. I had 26455 - just above the 76.4 fib - as the top of this mornings pullback, but once that broke I figured a kiss on the underside of the trendline support going back to Dec 26th was on the cards - and so it proved to be.
Ignored
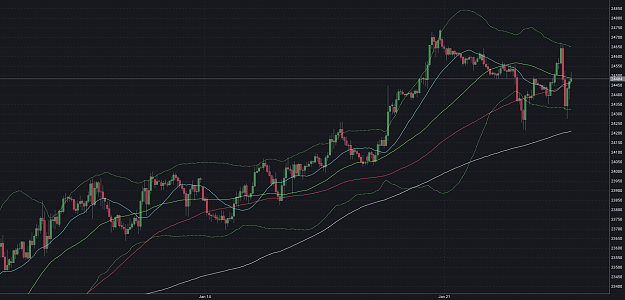
I also have other MAs on, such as SMA20. See how it guided DJI yesterday, for example. And at today's top SMA20 was beneath SMA50 - not a case for being bullish.
{quote} I also have other MAs on, such as SMA20. See how it guided DJI yesterday, for example. And at today's top SMA20 was beneath SMA50 - not a case for being bullish. {image}
Ignored
Likewise with the Linear Weighted 50 and the SMA 50. The LW capped yesterdays pa at the NY open before the drop, acted as a first line of resistance to the overnight move up and has stayed below the SMA 50 today.
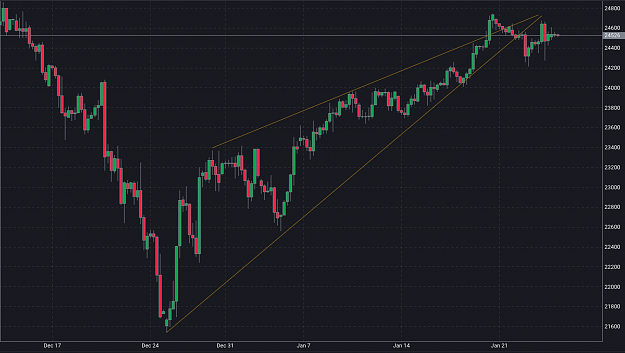
For those who haven't noted, DJI (and S&P 500) have broken out of a rising wedge. That seems to suggest that the correction to the upside is over, and that more chaotic price behaviour can be expected.
For those who haven't noted, DJI (and S&P 500) have broken out of a rising wedge. That seems to suggest that the correction to the upside is over, and that more chaotic price behaviour can be expected. {image}
Ignored
Thanks Medici, I had noticed, and I agree with you that the correction might be over at least the aggressive upside we've seen in the run up to these levels, but I don't see it turning straight back down yet, rather I see a period now of sloppy, extremely volatile range type pa whilst we build a good, solid technical pattern for the next leg down, so perhaps something similar to 2008 when the price did actually keep pushing very hesitantly higher until May. So I think we may well see the price rising still towards the upper limit of my critical range , which is 25,000 on the Dow, maybe as high as 25,200 or so, building towards what could be a significant next leg down sometime within the next few months.
Agreed. It may be weeks or months before another serious sell-off.Taking a simple-minded look at the S&P 500, it has conquered the support level from before the December sell-off, as well as the SMA50. The October sell-off was a break of SMA50, and subsequent sell-offs have been from above SMA200. So, yes, there are no apparent reasons that it couldn't wiggle its way up to SMA200 - another 100 points to the upside - before another sell-off.
And counting Elliott waves in the 4 hour chart (see my previous post) says that we're in wave four - a sideways consolidation - before the final burst upwards.
Agreed. It may be weeks or months before another serious sell-off.Taking a simple-minded look at the S&P 500, it has conquered the support level from before the December sell-off, as well as the SMA50. The October sell-off was a break of SMA50, and subsequent sell-offs have been from above SMA200. So, yes, there are no apparent reasons that it couldn't wiggle its way up to SMA200 - another 100 points to the upside - before another sell-off. And counting Elliott waves in the 4 hour chart (see my previous post) says that we're in wave four - a sideways...
Ignored
Great - someone who can read EW a whole lot better than me. What you say about being in a wave 4 makes absolute sense given the erratic pa and I totally misread what was unfolding earlier in the week - too much short term bias as usual. Once a wave 5 completes around the 25000 area or wherever, the question then becomes: does it turn around and plunge to new lows or are we in a larger degree of scale wave 1 (after the Dec low) of a final 5 up - in which case price will drop significantly from 25000 or wherever, but then rocket up in a wave 3 and go on to make a new high above 26950. Anyway I don't want to pontificate on EW too much as I know cat thinks it's gobbledegook and it's his thread,
{quote} Great - someone who can read EW a whole lot better than me. What you say about being in a wave 4 makes absolute sense given the erratic pa and I totally misread what was unfolding earlier in the week - too much short term bias as usual. Once a wave 5 completes around the 25000 area or wherever, the question then becomes: does it turn around and plunge to new lows or are we in a larger degree of scale wave 1 (after the Dec low) of a final 5 up - in which case price will drop significantly from 25000 or wherever, but then rocket up in a wave...
Ignored
Yes there's a lot of gobbledegook purported as "Elliott Wave Theory", I agree. But there are some genuine insight underneath. I learned the little I know from Tony Plummer's Forecasting Financial Markets - a brilliant book by a market practitioner. See also http://www.helmsman-economics.com. But, yes, let's not clutter the thread with discussions about these things.
{quote} Yes there's a lot of gobbledegook purported as "Elliott Wave Theory", I agree. But there are some genuine insight underneath. I learned the little I know from Tony Plummer's Forecasting Financial Markets - a brilliant book by a market practitioner. See also http://www.helmsman-economics.com. But, yes, let's not clutter the thread with discussions about these things.
Ignored
Thanks - I'll take a look. I also have the Robert Prechter book somewhere.
Dax traders it's worth paying attention to some pretty strong looking diversion on H4 and H6. I use just MACD along the bottom of my charts, and the 12/26/9 ribbon, though still unconfirmed, looks pretty nice for a possible fall from current levels. I would have posted this earlier but I was away all day, so just checking back in now to see how the day unfolded.