I like this It's clear.... it should be by now. And otherwise, I dare to ask. Let's get it done, practice and experience. Thank you Alan! Can you pls post the colored grid indicator?
Ignored
The coloured grid does not belong to me I will have to get permission to post it.
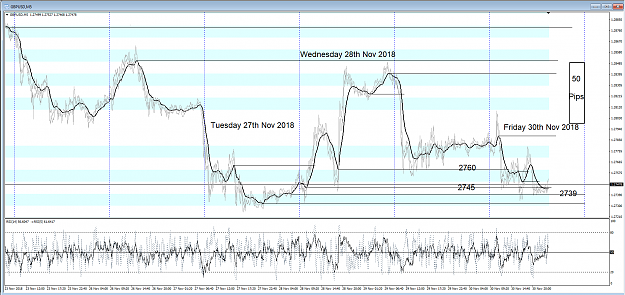
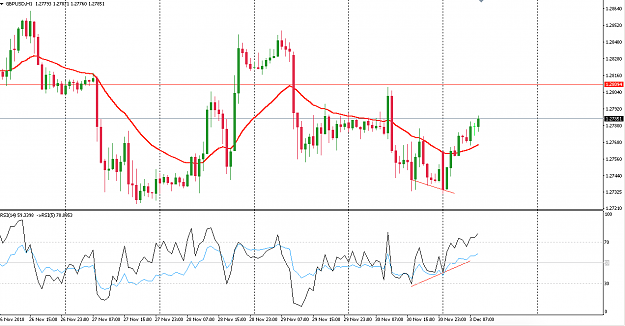
So tracking Fridays 5 min chart it should look something like this.. {image}
Ignored
Do you mind saying how you selected the average swing low target of 2745? There are m5 swing targets either side of this one. The2745 target looks good on the h1 chart.
{quote} Do you mind saying how you selected the average swing low target of 2745? There are m5 swing targets either side of this one. The2745 target looks good on the h1 chart.
Ignored
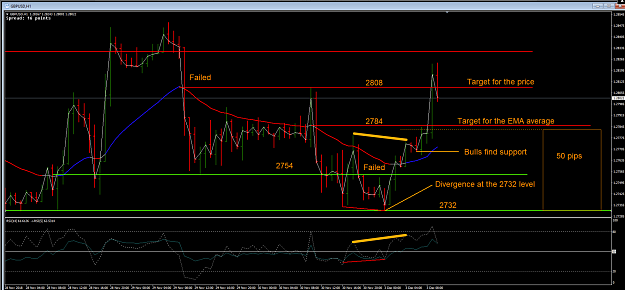
On the 5 min chart the 2760 average was the one be broken. To break this level price itself makes it to the next level which was 2745 which is enough to easily make the 50 pips required.
Then for the average to break this 2745 level price moves on to the next level 2739
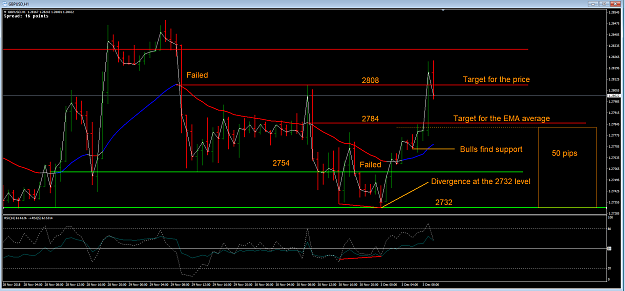
Attached Image (click to enlarge)
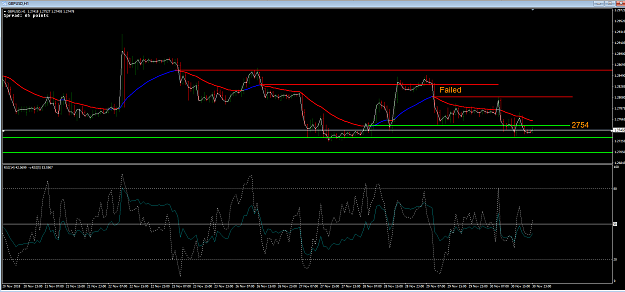
The 1 hour chart has not yet finished because the EMA is trying to break the average swing at 2754
{quote} Hi Nala, the trade happen so soon before Bar 108, how we should deal with this ?
Ignored
We can't catch every trade.
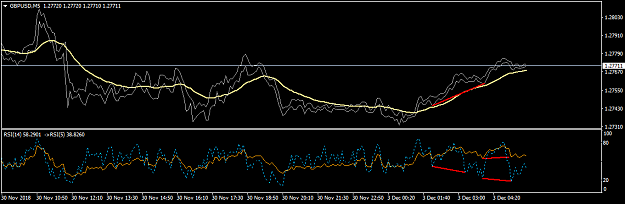
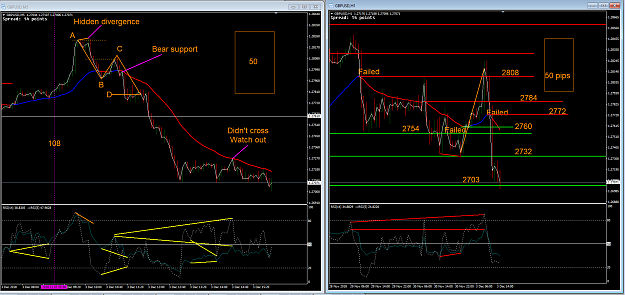
Well on the weekend I said the bears on the 1 hour had not yet finished but they were close enough to keep an eye on them from the open of the week. That would have presented the whole trade to you.
However from about bar 108 there was also bullish divergence on the 5 min but not enough of a target left to get the full 50 pips.
Then shortly after the bar 108 gave us a bearish divergence, the price target has been hit so this is a good likely short and as we watch the 1 hour we see the average again fails to make the HH so it is once again going to try for the LL
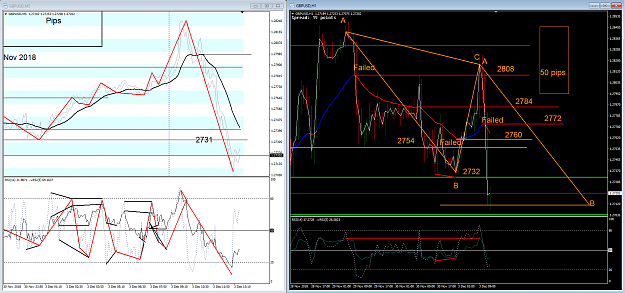
My charts look like this at the present
Attached Image (click to enlarge)
Don't worry about the ABC triangle you see here that is a whole different study than what I have presented.
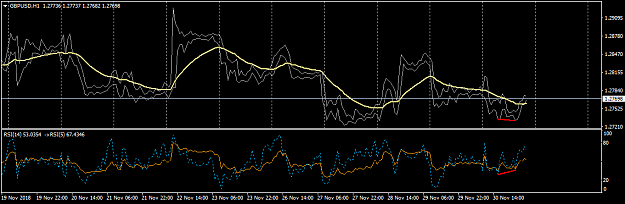
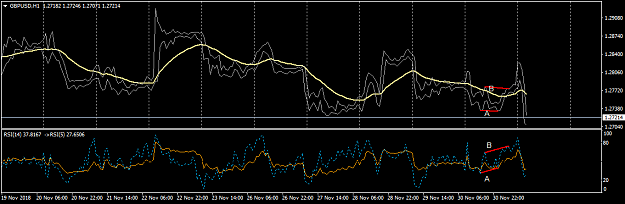
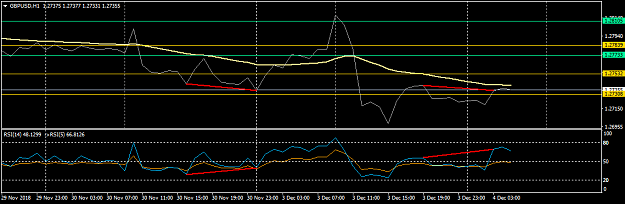
HI Alan. I refer to your Post 306. Your chart appears a little different from mine. On the H1 chart I have 2 regular divergences, A and B but in yours there is only A.
Is there an explanation for it? As you can see, my parameters for the RSI is the same as yours
HI Alan. I refer to your Post 306. Your chart appears a little different from mine. On the H1 chart I have 2 regular divergences, A and B but in yours there is only A. Is there an explanation for it? As you can see, my parameters for the RSI is the same as yours {image}
Ignored
I think Alan's chart is conform yours, isn't it? It shows this:
HI Alan. I refer to your Post 306. Your chart appears a little different from mine. On the H1 chart I have 2 regular divergences, A and B but in yours there is only A. Is there an explanation for it? As you can see, my parameters for the RSI is the same as yours {image}
Ignored
Hi Bydyke, there most certainly is an explanation for it.
You are using 2 simple moving averages to plot the high and low of the price on the 1 hour chart whereas I only use 1 SMA set to the close so it gives me a line chart on top of my bar chart.
The only reason I use the 2 SMA's on the 5 min chart is to see whether or not the price has actually reached the targets or not. Then I can plot the entire moves in the form of a zig zag from divergence to divergence.
We just hit the 2703 which is the lowest level I have on my charts. Still waiting for the EMA to make the LL, which it just did while I was typing Now is the EMA going to attack the 2732?
{quote} Hi Bydyke, there most certainly is an explanation for it. You are using 2 simple moving averages to plot the high and low of the price on the 1 hour chart whereas I only use 1 SMA set to the close so it gives me a line chart on top of my bar chart. The only reason I use the 2 SMA's on the 5 min chart is to see whether or not the price has actually reached the targets or not. Then I can plot the entire moves in the form of a zig zag from divergence to divergence.
Ignored
Ok, got it. Thanks. I'll be surprised if there is a better trading system than this.
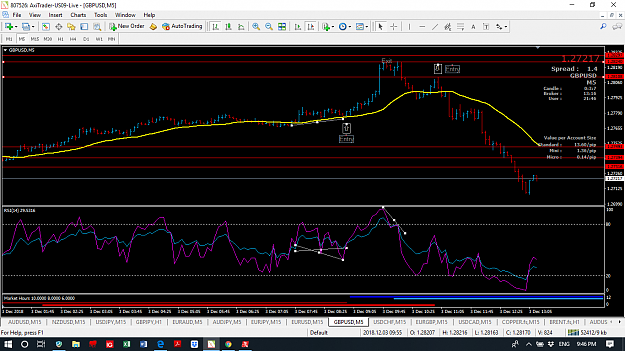
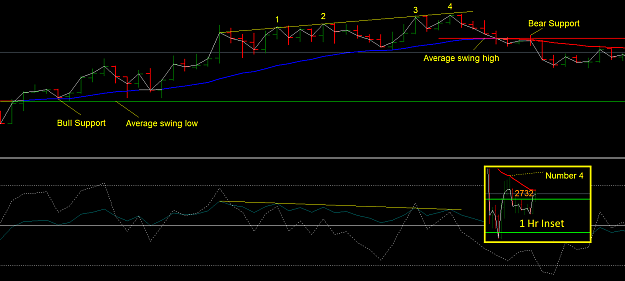
When we place a trade we also set the stop to limit the damages done by being wrong. Once the trade gets under way it is important to tease the stop into a breakeven situation and it is this stop that gets hit the most. This is all par for the course in trading if possible we lose nothing by covering our risk.
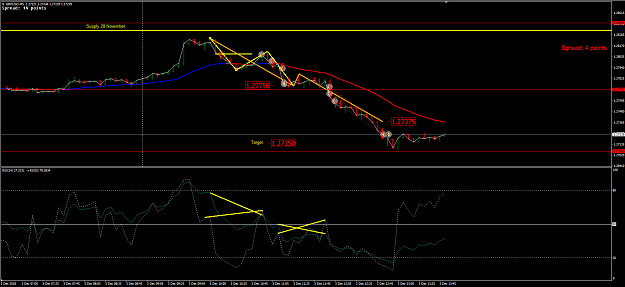
This can be a pain or rather a nuisance because we spend time looking, plotting and all for naught.
Look at this piece of chart where there was a bearish divergence in 4 different positions indicating a turn is on the cards. Taking a trade at each of them would have resulted in three break even stop outs to get to the fourth which paid us a few bob.
The reason for this is that only the 5 min chart is being used here, there is no inference from a higher time frame indicating a short is on offer.
Changing the time frame to a 1 hour (Shown as inset) you would see that the div at 4 was on the EMA, precisely the position we should be looking for a scalping entry.
It's clear.... it should be by now. And otherwise, I dare to ask. Let's get it done, practice and experience. Thank you Alan! Can you pls post the colored grid indicator?
Ignored