I know that probably few if any of the original posters are viewing this thread anymore, but I wanted to express my strong gratitude for all of those who have contributed, especially BillyRayValentine, Iron-Man, Mary Pippins, and Siam earlier on. While I'd read through both James16's and TraderDante's threads (and learned immense amounts from each), this is the first time I've actually had things click as to why a method works. Before, I never really understood why certain levels mattered or why I could have confidence that they would hold - in particular, an explanation of order stacking. Now I feel more confident in my trading and in my first few tries have had some incredible results.
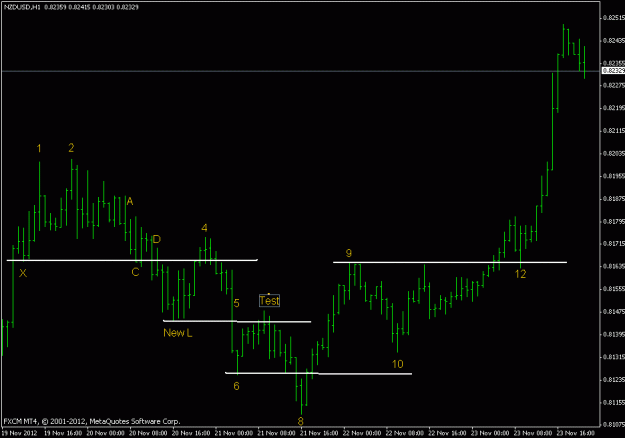
My first couple tries at this method ended up getting stopped out because I wasn't creating an appropriate range (price crept a few pips beyond and reversed), but I nailed an entry on the NZD/USD today, although I didn't make a lot of profit from it. I missed my first opportunity while I was sleeping but set an autotrade with a 1 pip + spread stoploss later on, and got in with around one pip drawdown before it moved in the other direction. Closed the trade after it failed to break support and then broke short term resistance on the 5 minute chart. The precision with which this works is just incredible and lends to some very nice opportunities.
http://i.imgur.com/YpC0Ll.png
If anybody wants to compare or is otherwise interested I'll be glad to upload some of my other charts as an attachment. I'd love to see this thread moving again.