How could an indicator like the one in the image be made?
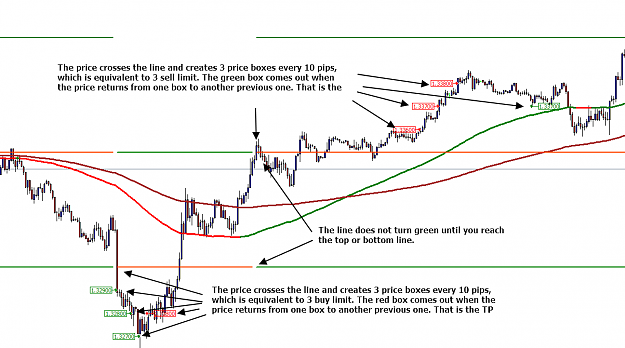
The indicator has horizontal green lines every 50 Pips. These lines, when traversed by the price, become red lines. And do not turn to green until they do not touch the top or bottom line +/- 50 Pips.
On the other hand, if the price crosses a line from the bottom upwards, 3 price boxes are created every 10 pips above the line, and vice versa when they go to the opposite direction.
Attached Image (click to enlarge)
TradingLove