Hey guys i want to show the snake eye method. Its an old strategy thats used by Floor traders.
What do you guys think about this strategy?
Credit goes to Akuma99
Snake-Eye Trading Method
This method applies the same techniques used by the professional Floor Traders and is based around what a 5 minute bar is indicating at any given time.
Chart Set Up
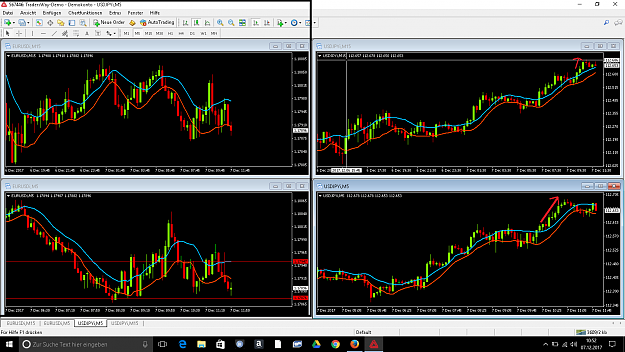
Set up and refer to these three charts only, no others:
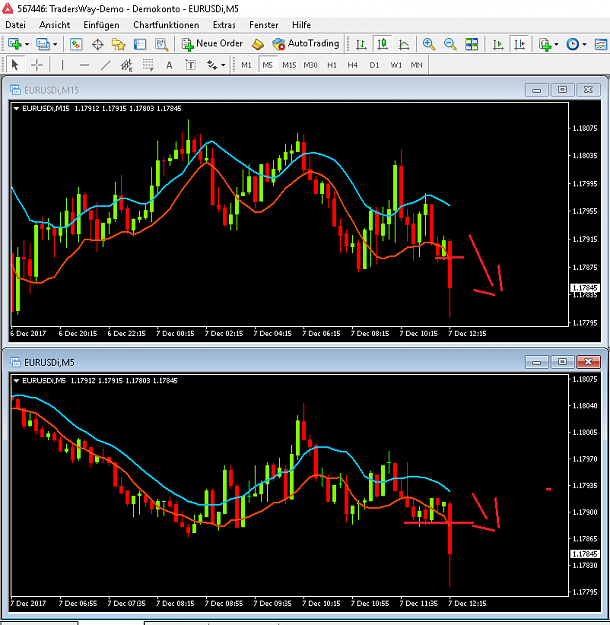
5 minute bar chart:
Set with a 8 period simple moving average set at “low” and 10 period simple moving average set “high” – configured with bars. This is the main chart used to look for trade set-ups.
15 minute bar chart:
Configured the same as 5 minute. This chart is mainly used to determine trend direction and is not to trade from.
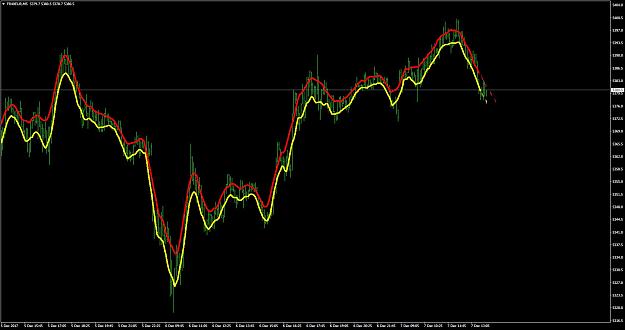
Moving Averages
These are used to assist with determining the strength, weakness or neutrality of the market and which direction to play it.
When the price is trading above the 10 moving average line on the 5-minute chart, with at least one full price bar having closed above and sitting on top of the line, this indicates strength, signaling potential upside and possibly a long trade forming.
When the price is trading below the 8 moving average line on the 5-minute chart, with at least one full price bar having closed below and fully formed below the line, this indicates weakness, signaling potential downside and possibly a short trade forming.
Whenever the price bars trade above the 10 moving average line or below the 8 moving average line on the 15-minute chart, this is a stronger confirmation of direction than when on the 5-minute chart.
Trend Direction
It is important to know this at all times, as you must always trade in the direction of the trend, never against it. Trend direction is mainly determined by reference to the 15-minute bar chart and where the price bars are trading in reference to the 8 and 10 moving averages, as previously
explained.
The direction in which the moving average lines are pointing on both the 5-minute and15-minute charts is a good visual reference for determining trend direction. There may be an obvious trend direction established for the day, but short-term trend changes will inevitably occur and will be indicated by changes in the direction the moving average lines form, either pointing up, down or sideways.
Another indicator is that whenever the moving average lines on the 5- minute and 15-minute charts start to narrow, coming closer together; this often signals a change in direction is about to occur. This is generally followed by them widening again to form what looks like the shape of a
mouth, prior to the change.
The Set-Up
To recognize a good set-up, you must first develop a “feel” for the market and the market flow.
Go back to basics and literally forget all you have learned. Cast aside all of your indicators and simply watch the 5-minute bars, their behavior, formations and patterns.
Further training is required to accurately and consistently recognize the correct set-ups. However, the principal of the method relies on the current 5-minute bar’s inability to take out the previous bar (or bars) high for a “short” set-up and inability to take out a low in the case of a “long” set–up.
With experience and a high degree of concentration in watching the price activity during the formation of the current 5-minute bar, the immediate, short-term direction of the market can be determined with an uncanny accuracy.
By observing and counting the number of times the current price bar pushes in it’s attempt to take out the high or low of the previous bar (or bars), can provide a clue as to who is in control the buyers or the sellers.
For example, if the price bar ticker pushes and pushes upwards at the top of the bar, failing to get any higher and is unable to take out the immediate, previous highs and then closes, it signals that it has hit resistance at this level and that the buyers are drying up and losing control. If the buyers have dried up, then the path of least resistance is down, as the sellers have now taken over control. This is a time to sell, as prices and the market are going down.
The same holds true when the price bar ticker pushes and pushes downwards at the bottom of the bar, failing to break through and getting support, indicating no more sellers, so the price is likely to reverse and go up. This is a time to buy as the market reverses; gains strength and prices start to immediately increase
The ratio of buyers to sellers is what determines the market direction at any given time. If you see a possible set-up forming, never take your eyes off the bar, or you will miss the message it is giving you…you must watch it very closely. As soon as you have made the decision that it is a set-up, don’t hesitate, don’t wait, get in and take the trade.
Long Set–Up
To take a long trade (buy), the price bars must be trading above the 10 moving average line on the 5-minute chart, which indicates strength. At least one price bar must be fully formed, closed and sitting above on top of the line to allow a conservative trade – 2 bars for a more conservative trade.
Short Set-Up
To take a short trade (sell), the price bars must be trading below the 8 oving average line on the 5-minute bar chart, which indicates weakness. At least one price bar must be fully formed, closed and sitting below the line to allow a conservative trade – 2 bars for a more conservative trade.
Stop Loss
As soon as a trade is entered into, immediately place a stop loss order for whatever amount suits your personal risk tolerance. The method allows at least 2 points. This is very important for peace of mind and to limit your downside risk.
Once your trade is a few points profitable, it may be possible to move your stop to breakeven, but care should be taken to avoid being stopped out too soon and possibly causing you to miss a good run.
Exiting the Trade
This can vary and is often determined by each individual’s personal experience, financial circumstances and risk tolerance. As a relatively inexperienced, student trader a conservative approach is to take 2, 3 or 4 points and button down a profit when it is there, even though the trade may go on to produce more points. You can never lose by taking a profit and in the early stages of trading; taking regular, small profits will build confidence. Experience and improved confidence will then allow you to stay in for the longer term and greater rewards.
Congestion (choppy, chop)
Chop is a very difficult market to trade and should be avoided as soon as you realize it is in this phase. Never trade a choppy market. Whenever the price bars trade in a channel between the 8 and 10 moving averages,
without seriously penetrating or staying above or below them, then the market is choppy. The price bars traverse up and down between or a little beyond the two moving averages.
Inevitably congestion follows trend and trend follows congestion, so whenever the market has gone into congestion, just be patient, sit it out and wait for the next trend breakout, it often provides a good move.
If you don’t change today – your tomorrows will be like your yesterdays.
Golden Rules
• Never trade on a day when Greenspan is talking, or any major news, without lots of practice…till you learn how to trade that volatility.
• Forget all that you have learned from seminars and books – scrap all of your indicators and do not look at 1 or 3 min charts.
• Never trade against the trend. ”The trend’s your friend”, so only trade with it.
• Never trade in a choppy market - congestion.
• Always place a stop loss order (Use a trailing stop loss).
• Never try to pick tops and bottoms – let the market tell you where it wants to go.
• Don’t overtrade, 1–3 good trades per day is enough.
• Don’t be greedy.
• Don’t have any distractions, TV, telephone, people etc. while you are trading.
• Manage your money – take all profits out of your trading account at the end of each month. This way your trading account does not grow too large and may just prevent you from taking impulsive, foolish trades due to over- confidence.
What do you guys think about this strategy?
Credit goes to Akuma99
Snake-Eye Trading Method
This method applies the same techniques used by the professional Floor Traders and is based around what a 5 minute bar is indicating at any given time.
Chart Set Up
Set up and refer to these three charts only, no others:
5 minute bar chart:
Set with a 8 period simple moving average set at “low” and 10 period simple moving average set “high” – configured with bars. This is the main chart used to look for trade set-ups.
15 minute bar chart:
Configured the same as 5 minute. This chart is mainly used to determine trend direction and is not to trade from.
Moving Averages
These are used to assist with determining the strength, weakness or neutrality of the market and which direction to play it.
When the price is trading above the 10 moving average line on the 5-minute chart, with at least one full price bar having closed above and sitting on top of the line, this indicates strength, signaling potential upside and possibly a long trade forming.
When the price is trading below the 8 moving average line on the 5-minute chart, with at least one full price bar having closed below and fully formed below the line, this indicates weakness, signaling potential downside and possibly a short trade forming.
Whenever the price bars trade above the 10 moving average line or below the 8 moving average line on the 15-minute chart, this is a stronger confirmation of direction than when on the 5-minute chart.
Trend Direction
It is important to know this at all times, as you must always trade in the direction of the trend, never against it. Trend direction is mainly determined by reference to the 15-minute bar chart and where the price bars are trading in reference to the 8 and 10 moving averages, as previously
explained.
The direction in which the moving average lines are pointing on both the 5-minute and15-minute charts is a good visual reference for determining trend direction. There may be an obvious trend direction established for the day, but short-term trend changes will inevitably occur and will be indicated by changes in the direction the moving average lines form, either pointing up, down or sideways.
Another indicator is that whenever the moving average lines on the 5- minute and 15-minute charts start to narrow, coming closer together; this often signals a change in direction is about to occur. This is generally followed by them widening again to form what looks like the shape of a
mouth, prior to the change.
The Set-Up
To recognize a good set-up, you must first develop a “feel” for the market and the market flow.
Go back to basics and literally forget all you have learned. Cast aside all of your indicators and simply watch the 5-minute bars, their behavior, formations and patterns.
Further training is required to accurately and consistently recognize the correct set-ups. However, the principal of the method relies on the current 5-minute bar’s inability to take out the previous bar (or bars) high for a “short” set-up and inability to take out a low in the case of a “long” set–up.
With experience and a high degree of concentration in watching the price activity during the formation of the current 5-minute bar, the immediate, short-term direction of the market can be determined with an uncanny accuracy.
By observing and counting the number of times the current price bar pushes in it’s attempt to take out the high or low of the previous bar (or bars), can provide a clue as to who is in control the buyers or the sellers.
For example, if the price bar ticker pushes and pushes upwards at the top of the bar, failing to get any higher and is unable to take out the immediate, previous highs and then closes, it signals that it has hit resistance at this level and that the buyers are drying up and losing control. If the buyers have dried up, then the path of least resistance is down, as the sellers have now taken over control. This is a time to sell, as prices and the market are going down.
The same holds true when the price bar ticker pushes and pushes downwards at the bottom of the bar, failing to break through and getting support, indicating no more sellers, so the price is likely to reverse and go up. This is a time to buy as the market reverses; gains strength and prices start to immediately increase
The ratio of buyers to sellers is what determines the market direction at any given time. If you see a possible set-up forming, never take your eyes off the bar, or you will miss the message it is giving you…you must watch it very closely. As soon as you have made the decision that it is a set-up, don’t hesitate, don’t wait, get in and take the trade.
Long Set–Up
To take a long trade (buy), the price bars must be trading above the 10 moving average line on the 5-minute chart, which indicates strength. At least one price bar must be fully formed, closed and sitting above on top of the line to allow a conservative trade – 2 bars for a more conservative trade.
Short Set-Up
To take a short trade (sell), the price bars must be trading below the 8 oving average line on the 5-minute bar chart, which indicates weakness. At least one price bar must be fully formed, closed and sitting below the line to allow a conservative trade – 2 bars for a more conservative trade.
Stop Loss
As soon as a trade is entered into, immediately place a stop loss order for whatever amount suits your personal risk tolerance. The method allows at least 2 points. This is very important for peace of mind and to limit your downside risk.
Once your trade is a few points profitable, it may be possible to move your stop to breakeven, but care should be taken to avoid being stopped out too soon and possibly causing you to miss a good run.
Exiting the Trade
This can vary and is often determined by each individual’s personal experience, financial circumstances and risk tolerance. As a relatively inexperienced, student trader a conservative approach is to take 2, 3 or 4 points and button down a profit when it is there, even though the trade may go on to produce more points. You can never lose by taking a profit and in the early stages of trading; taking regular, small profits will build confidence. Experience and improved confidence will then allow you to stay in for the longer term and greater rewards.
Congestion (choppy, chop)
Chop is a very difficult market to trade and should be avoided as soon as you realize it is in this phase. Never trade a choppy market. Whenever the price bars trade in a channel between the 8 and 10 moving averages,
without seriously penetrating or staying above or below them, then the market is choppy. The price bars traverse up and down between or a little beyond the two moving averages.
Inevitably congestion follows trend and trend follows congestion, so whenever the market has gone into congestion, just be patient, sit it out and wait for the next trend breakout, it often provides a good move.
If you don’t change today – your tomorrows will be like your yesterdays.
Golden Rules
• Never trade on a day when Greenspan is talking, or any major news, without lots of practice…till you learn how to trade that volatility.
• Forget all that you have learned from seminars and books – scrap all of your indicators and do not look at 1 or 3 min charts.
• Never trade against the trend. ”The trend’s your friend”, so only trade with it.
• Never trade in a choppy market - congestion.
• Always place a stop loss order (Use a trailing stop loss).
• Never try to pick tops and bottoms – let the market tell you where it wants to go.
• Don’t overtrade, 1–3 good trades per day is enough.
• Don’t be greedy.
• Don’t have any distractions, TV, telephone, people etc. while you are trading.
• Manage your money – take all profits out of your trading account at the end of each month. This way your trading account does not grow too large and may just prevent you from taking impulsive, foolish trades due to over- confidence.