Are you tracking EURJPY this week? Consider this technical perspective.
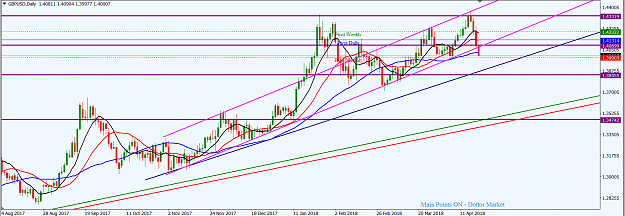
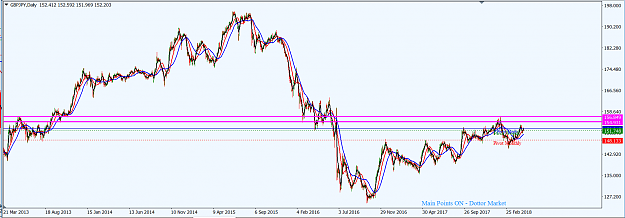
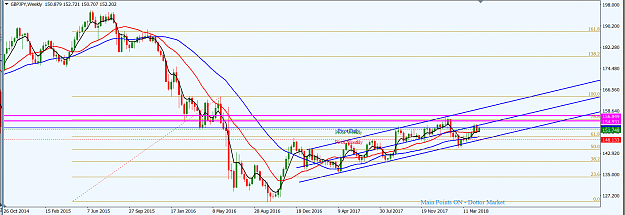
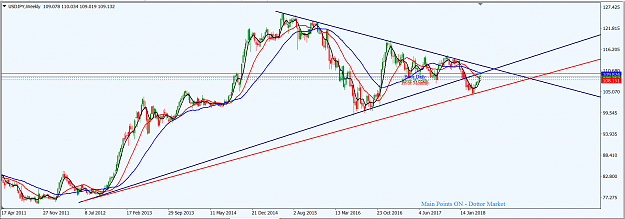
Price action on the daily time frame is now around a resistance zone. Although a shooting-star like candlestick was printed last week Friday, the technicals are still disposed northward. We may see a pullback southward into the mean or the support trendline (blue) before price action continues northward. However, there are a few resistance areas which bulls will have to contend with: the horizontal resistance around the 134.250 area and the resistance trendline (magenta) seen on the weekly time frame.
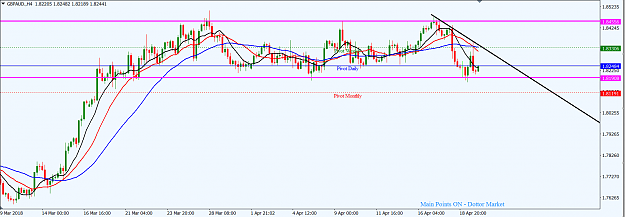
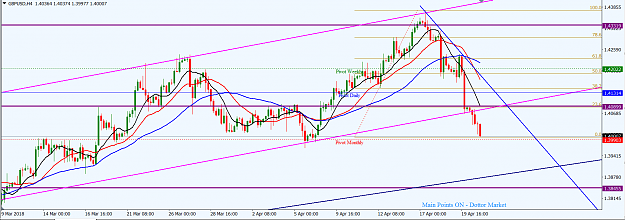
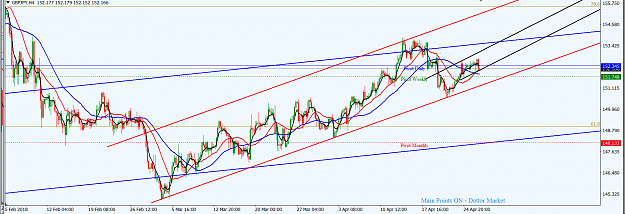
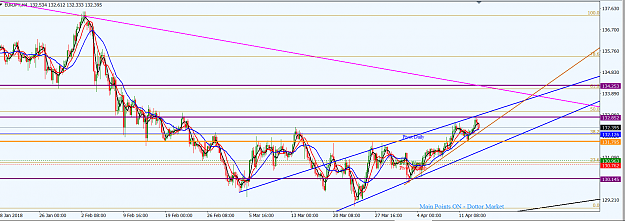
On the H4 time frame, price action is operating in an ascending wedge (blue). Giving the context of the major trend (looking left), there is likely to be a bearish turnaround after the corrective phase. The last three sessions last Friday printed three bearish candlesticks; but the order flow context is largely under the bulls. Besides, a micro support trendline (chocolate) is still in play. Nevertheless, there are a few barriers for bulls to scale: wedge resistance trendline, horizontal resistance (minor resistance around 133.180; major resistance around 134.250) and resistance trendline (magenta). On the other hand, should the micro support trendline (chocolate) be broken down by bears, they will have to contend with the minor horizontal support (dark orange) around the 131.795 area before heading for the wedge support trendline. A breakdown of the support trendline on at least a four-hourly basis, with a retest and zone flip, is likely to give the impetus for a bearish continuation.
I may be wrong. Trade safe and prosper.
KP
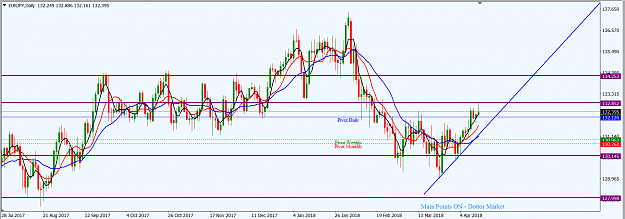
Price action on the daily time frame is now around a resistance zone. Although a shooting-star like candlestick was printed last week Friday, the technicals are still disposed northward. We may see a pullback southward into the mean or the support trendline (blue) before price action continues northward. However, there are a few resistance areas which bulls will have to contend with: the horizontal resistance around the 134.250 area and the resistance trendline (magenta) seen on the weekly time frame.
On the H4 time frame, price action is operating in an ascending wedge (blue). Giving the context of the major trend (looking left), there is likely to be a bearish turnaround after the corrective phase. The last three sessions last Friday printed three bearish candlesticks; but the order flow context is largely under the bulls. Besides, a micro support trendline (chocolate) is still in play. Nevertheless, there are a few barriers for bulls to scale: wedge resistance trendline, horizontal resistance (minor resistance around 133.180; major resistance around 134.250) and resistance trendline (magenta). On the other hand, should the micro support trendline (chocolate) be broken down by bears, they will have to contend with the minor horizontal support (dark orange) around the 131.795 area before heading for the wedge support trendline. A breakdown of the support trendline on at least a four-hourly basis, with a retest and zone flip, is likely to give the impetus for a bearish continuation.
I may be wrong. Trade safe and prosper.
KP
Attached Image (click to enlarge)
Attached Image (click to enlarge)
Do your homework, follow the footprints of smart money
1