If you are tracking EURJPY, consider this technical perspective.
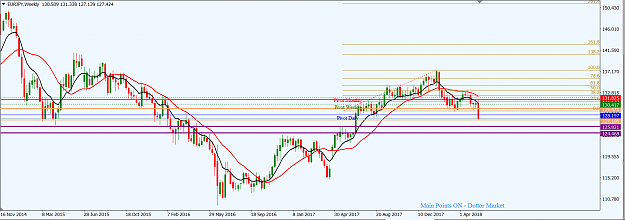
On the weekly time frame, price action is operating in an ascending channel (black). Since mid-February 2018, price action has been operating below the midline of the channel (blue). In the last two weeks of April 2018, the market consolidated around a horizontal resistance. Last week, bears pulled southward of the consolidation with a relatively big bearish candlestick which temporarily breached the channel support until bulls intervened. The location of the most recent price action is the channel support line. Given the potency of last week’s bearish candlestick, we may see bears make another attempt to breach the channel support this week. Such a move is likely to expose the minor horirzontal support around 128.820.
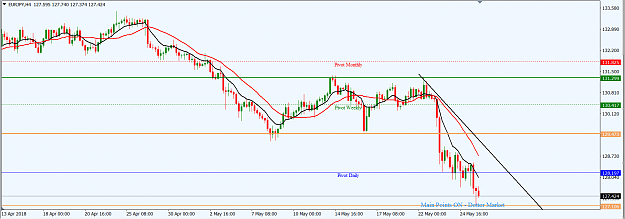
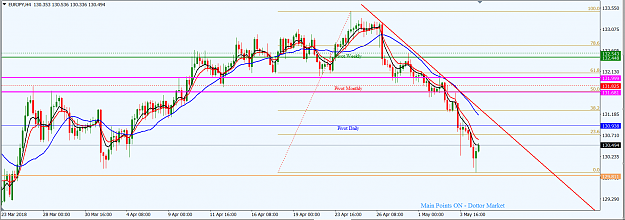
On the H4 time frame, the southward momentum is apparently waning. Two bullish candlesticks which formed in the latter part of last week Friday seem to portend a northward pullback; which is likely to retest a recently broken down support zone and may flip the zone as resistance. Such a zone is around 131.680/132.000 (bound by magenta horizontal lines) and is proximal to the monthly pivot. It is also in confluence with the 50/61.8 Fib zone of the downward swing from 133.550 to 129.885. However, we may see price action turn southward after a northward retracement to the 38.2 Fib zone (around 131.220), which is near the mean. The descending trendline (red) from the high of April 26, 2018 is in play and is acting as resistance.
I may be wrong. Trade safe and prosper.
KP
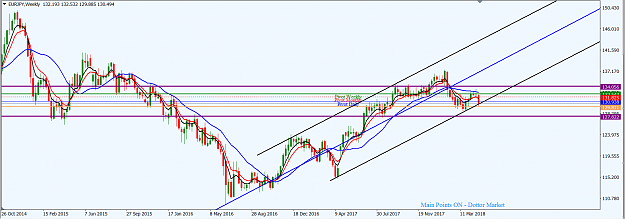
On the weekly time frame, price action is operating in an ascending channel (black). Since mid-February 2018, price action has been operating below the midline of the channel (blue). In the last two weeks of April 2018, the market consolidated around a horizontal resistance. Last week, bears pulled southward of the consolidation with a relatively big bearish candlestick which temporarily breached the channel support until bulls intervened. The location of the most recent price action is the channel support line. Given the potency of last week’s bearish candlestick, we may see bears make another attempt to breach the channel support this week. Such a move is likely to expose the minor horirzontal support around 128.820.
On the H4 time frame, the southward momentum is apparently waning. Two bullish candlesticks which formed in the latter part of last week Friday seem to portend a northward pullback; which is likely to retest a recently broken down support zone and may flip the zone as resistance. Such a zone is around 131.680/132.000 (bound by magenta horizontal lines) and is proximal to the monthly pivot. It is also in confluence with the 50/61.8 Fib zone of the downward swing from 133.550 to 129.885. However, we may see price action turn southward after a northward retracement to the 38.2 Fib zone (around 131.220), which is near the mean. The descending trendline (red) from the high of April 26, 2018 is in play and is acting as resistance.
I may be wrong. Trade safe and prosper.
KP
Attached Image (click to enlarge)
Attached Image (click to enlarge)
Do your homework, follow the footprints of smart money