Ok to begin, this pattern is to be used for potential areas of where price will go. I will explain the basics of the pattern in the first few posts, then expand on potential ways to act with price movement.
To begin we look for Aggressive price movements where we have x number of candles in a row. It doesn't matter how many candles in row but its more about the price movement of the candles compared to previous price movement.
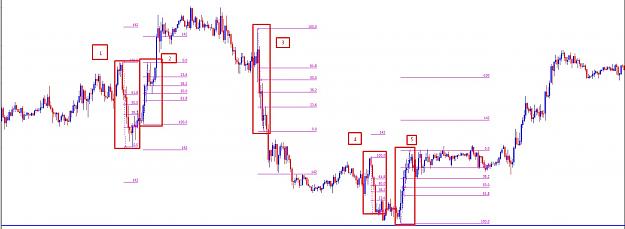
Example if price is moving within a deviation of 100-250 ticks, back and forth, then we get a price movement of 400 ticks with 5 candles in a row, this would be considered for price projection. we then draw the fibo area with a 142 projection.
This is the simple form of the pattern. Of course price doesnt always hit the 142 but instead will reverse these ideas will be covered in the following posts.
Example 1: 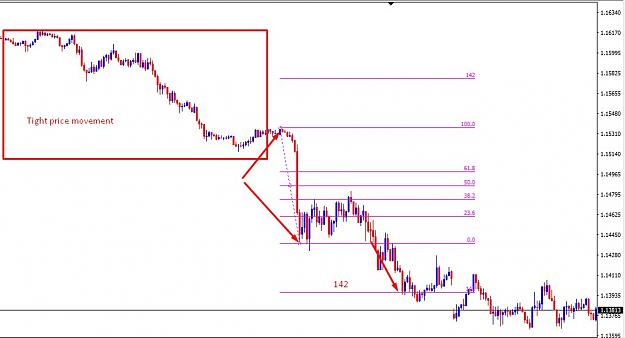
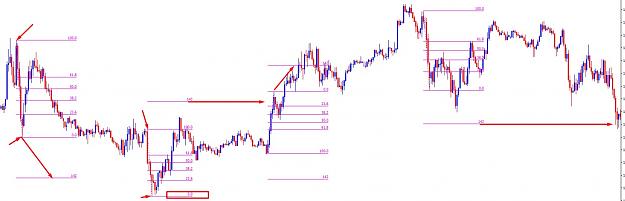
Example 2: In the second pattern you will notice price never broke below the LOW. but instead reversed hitting the 142 on the opposite side.
To begin we look for Aggressive price movements where we have x number of candles in a row. It doesn't matter how many candles in row but its more about the price movement of the candles compared to previous price movement.
Example if price is moving within a deviation of 100-250 ticks, back and forth, then we get a price movement of 400 ticks with 5 candles in a row, this would be considered for price projection. we then draw the fibo area with a 142 projection.
This is the simple form of the pattern. Of course price doesnt always hit the 142 but instead will reverse these ideas will be covered in the following posts.
Example 1:
Attached Image (click to enlarge)
Example 2: In the second pattern you will notice price never broke below the LOW. but instead reversed hitting the 142 on the opposite side.
Attached Image (click to enlarge)
Learn, a forex trader must, unlearn and relearn he will.