{quote} This is based off of price itself (close to close) so you should be able to add a moving average of 1 to your chart and get the exact middle or change from candle to line chart.
Ignored
Hi: Thanks for the answer. 1 period simple ma is right in the middle. Way better thinking than mine. It did not help in a way I hoped it would. Oh well. Thanks for the reply. MDAVEM
{quote} Could you please add your TPL? - very nice chart Thank you!
Ignored
Hi: I do not have a template for this one but will find the time in next couple of days to post one. This one was made just to post here. If you saw what I have on the screen I watch all the time it may scare you. It scares me sometimes. MDAVEM Glad you like the way it looks.
{quote} I know, sorry. Pictures before were much better... I realised we can get more accurate sell and buy if we check price high/low. But it's not done yet. However it will be clear when you get into it. I will of course work on it. But it is really hard sometimes since it is not "clear" like you can trade trend with simple MA. But it's worth it. SF
Ignored
Don't sweat it mate you doing a great job, you and Hephzibah
{quote} Hi: I do not have a template for this one but will find the time in next couple of days to post one. This one was made just to post here. If you saw what I have on the screen I watch all the time it may scare you. It scares me sometimes. MDAVEM Glad you like the way it looks.
{quote} I noticed the same when I put it on another account. Not sure why that happened but try this version, it should be fine. EDIT - sorry, v3 still wasn't correct but I think v4 is ok now and should draw both the channels and the dots {file}
Ignored
Hi,
Would it be possible to also fix the lag with your mighty fine indicator please?
When you test it on e.g. a 5 minute time frame via the strategy tester, the dots appear one or two bars behind the current candle.
Thank you
Scchplendid
{quote} Hi, Would it be possible to also fix the lag with your mighty fine indicator please? When you test it on e.g. a 5 minute time frame via the strategy tester, the dots appear one or two bars behind the current candle. Thank you Scchplendid
Ignored
Maybe you should re read post #520 where I first posted the idea. Here is a quote from it:
"The dot may repaint until the close of the second bar following the spike so you must wait for the close."
The indicator is fractal which means that you have to have at least two bars following the spike before you can know if it is a spike.
If it's not too much trouble, can you please explain the thinking behind the two Keltner channels and say more about the process of how a place for a dot is chosen. I am trying to replicate this on futures and cannot figure out two questions,
1) why is there the out keltner channel,
2) what is the principle behind selecting a place for a dot.
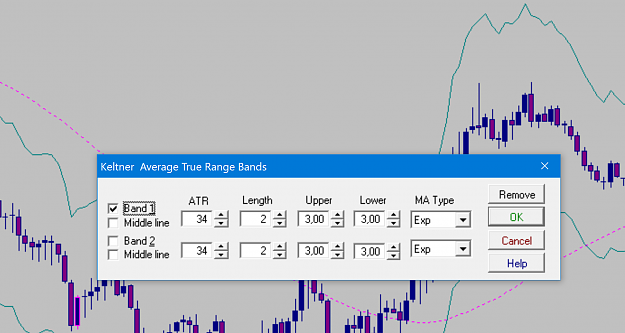
Here is a simple and reliable way of trading the channels (but just one of very many as this thread has shown). I made a modified Keltner Channel that prints a dot when a spike has occurred. The dot may repaint until the close of the second bar following the spike so you must wait for the close. If the last channel cross was up the dot is blue, if it was down it will be magenta. I have charted two channels, one with settings 1, 10, 3 (inner channel) and one with settings 1, 10, 9 (outer channel). If both channels are printing blue ascending dots...
Dear hepsibah, If it's not too much trouble, can you please explain the thinking behind the two Keltner channels and say more about the process of how a place for a dot is chosen. I am trying to replicate this on futures and cannot figure out two questions, 1) why is there the out keltner channel, 2) what is the principle behind selecting a place for a dot. Thanks in advance! {quote}
Ignored
Sorry the explanation is not clear, I shall try again.
A dot marks a spike on the channel e.g. for the upper channel, it looks for a one bar down move followed by a two bar up move (a fractal). Once the three bar pattern has completed, it will place a dot at the spike two bars back.
If the last cross of the channel was up i.e. the lower channel crossed up above the lowest down spike on the upper channel, the trend is up and the dot will be blue. If the trend is down, the dot will be magenta.
The purpose of having two channels is that the inner one represents a shorter tf, the outer a longer tf. So, if both channels are printing blue dots, they are both in an up trend, if they are different colours it could be showing a consolidation period.
As with all indicators, this should only be used as a guide in conjunction with price action. Price action is always king.
Hi: Thanks for the thread. Attached image is how I am trying to use this. The bands are the original ones from the thread. The filter is "saducky" which I think is a modified HA indicator. Will post if wanted. Have other filters but do not want to clutter chart. I simply look for a break thru a well defined peak of the channels. I also have a screen with a 5 minute chart as a time to pay attention view but use the 15 minute for entries. Enough said, I do have a strange request. Could someone add an extra to the original Father indicator. If possible...
Ignored
About the picture.
"Enter short" - no way Peak ("chanels cross") formed by the LL and Saducky can not filter this signal. As any MA-based indicators can not filter anything because of their avegaging (=delaying) formulas.
Just the simple channel cross that Heps discovered is a $ maker.
Don´t need much more, just to be there at the right time.
Range markets will produce only small loosers or BE.
Once you know wich side of the market to trade, (after a channel cross.) Then, you can apply whatever suits you to enter (and exit). IchimokusewavesfibostochastosmacdosPricaActionmovianaveragostrendlineos... You can even go to a smaller TF and look for the next channel break there..
Ignored
This is exactly right. Or you can use the channel cross as confirmation of something e.g. I mainly use raw price action these days and the channels and crosses help to let me know if price is currently in consolidation or a trend and, if in a trend it will help to keep me in for longer. As I have said several times before, M and W patterns seem much clearer in the channels.
Just the simple channel cross that Heps discovered is a $ maker. Don´t need much more, just to be there at the right time. Range markets will produce only small loosers or BE. This is a USDCHF 15M from yesterday {image}
Ignored
Would you be so kind as to provide the settings for the indicators which you have applied in your diagram post please?
{quote} I use Dynamic Trader software, with Keltner Channels.(see picture) Settings are "similar" to the ones posted in this thread. Original settigs (Silent) are from cTrader There´s a latest version of cTrader: https://financefeeds.com/newest-vers...hart-features/ {image}
We have seen many ways of using the channels in the thread but I believe that one of the most effective uses for me is using them in conjunction with PA. My loose definition of PA here means recognising where in a PA cycle you are (which can be any tf but works best if you know the cycles above your chosen tf as well) and then recognising the give away patterns that show intention of direction.
Price moves in a very consistent manner from consolidation to trend (generally three pushes/legs) to consolidation etc. The periods of consolidation are where transactions are being accumulated in order to push the price in a given direction. Give away clues as to the future direction can be seen in the pins (long wicks) and in price formations like Ws at the bottom and Ms at the top.
With the channels I can now see much more clearly when price is in consolidation and when it has moved into a trend and it then becomes much easier for me to see and count the three pushes and gives earlier clues as to when the leg may be running out of steam.
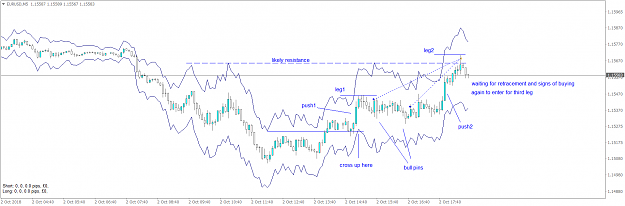
I missed this morning's big move unfortunately as I was out but this is a recent couple of trades I have just closed.
1. I am looking to see if it is still in consolidation and the channel crossed up so it is likely we are in a new up trend but I need more confirmation that this is not the top of a consolidation channel
2. The large bar labelled push1 which gives me confirmation that this is a new up trend. I now need to wait for signs that the next push may be coming and the big bull pins give me a good indication that upside accumulation is going on so I enter.
3. Sure enough push2 comes along and so I need to look for when to exit without leaving too much on the table and I do this when I see price hitting the previous peaks of the upper channel. Usually I would have waited for bear pins to start appearing but using the channels gets me out actually in the first pin.
4. now I wait for bull pins to appear again to show me that leg 3 may be coming
etc.
So the channels have really aided what I am usually looking for by confirming the direction, helping to identify the legs and showing an ideal exit point. And if I have counted incorrectly a new cross over to the downside will get me out.
Putting it into context We have seen many ways of using the channels in the thread but I believe that one of the most effective uses for me is using them in conjunction with PA. My loose definition of PA here means recognising where in a PA cycle you are (which can be any tf but works best if you know the cycles above your chosen tf as well) and then recognising the give away patterns that show intention of direction. Price moves in a very consistent manner from consolidation to trend (generally three pushes/legs) to consolidation etc. The periods...
Ignored
Right on Heps!!
I´m an Elliot Wave fan, look at the similar results from this other perspective.
Your legs are my waves.
Dynamic Trader Software, marked the "maximum" Time and Price are for the end of wave 5, in advance.(pink square).
Easier said that done, I was also away today, but did manange a winner on AUDCAD 5 m.
Still learning here...
{quote} Right on Heps!! I´m an Elliot Wave fan, look at the similar results from this other perspective. Your legs are my waves. Dynamic Trader Software, marked the "maximum" Time and Price are for the end of wave 5, in advance.(pink square). Easier said that done, I was also away today, but did manange a winner on AUDCAD 5 m. Still learning here... {image}
Ignored
Great! I'm a follower of Captain Jack who only looks for three legs but I must admit I often see more. But it doesn't much matter if there are at least three and you can then start looking for the signs of a turn. And the channels certainly add another valuable tool to the box.
{quote} Great! I'm a follower of Captain Jack who only looks for three legs but I must admit I often see more. But it doesn't much matter if there are at least three and you can then start looking for the signs of a turn. And the channels certainly add another valuable tool to the box.
Ignored
Exactly, impulsive waves are only 3
(2 and 4 are only correction to the other ones).
And yes, sometimes there´s more...(market doesn´t read books.)
As always, it´s a matter of adding up odds on your favour.