AUDUSD Weekly Technical Outlook
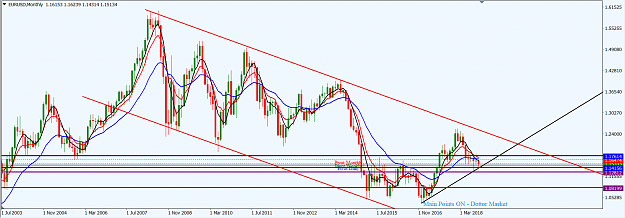
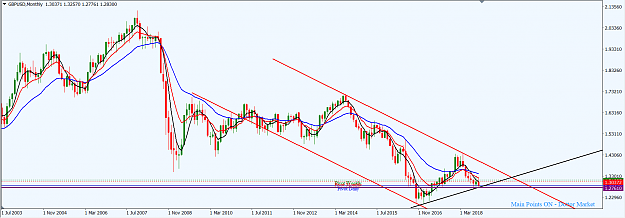
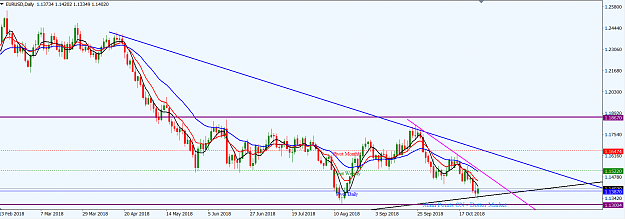
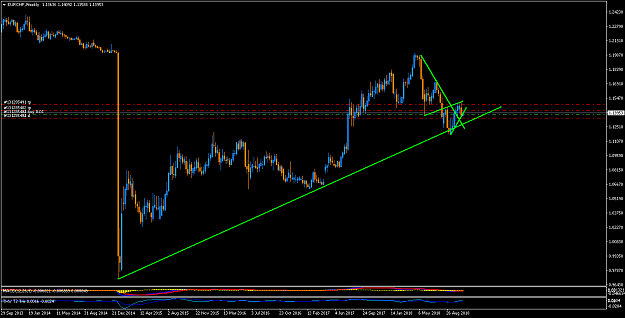
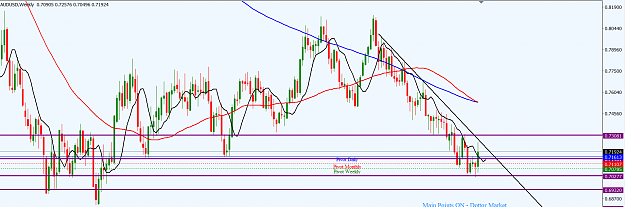
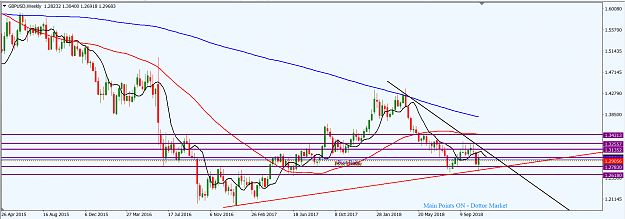
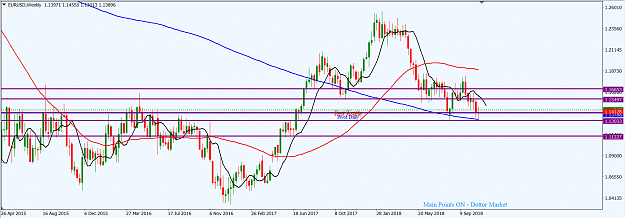
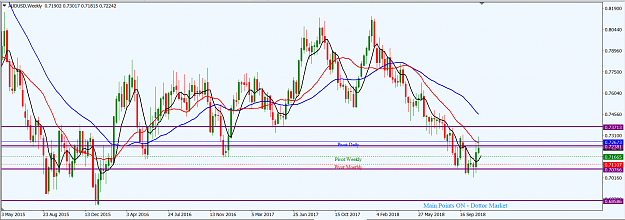
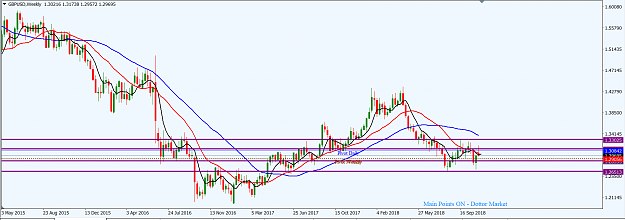
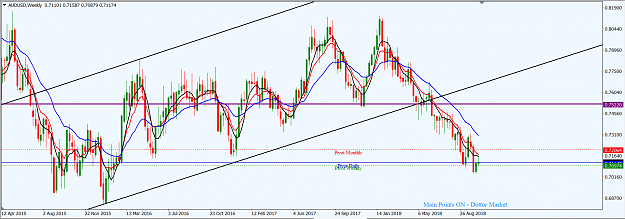
The downward move on the AUDUSD market that started upon the break of the ascending channel (black) in June 2018 has not seen significant momentum. On the weekly time frame, even though the market is still disposed southward, there has been a series of northward corrections. Four weeks ago, price action printed a bearish candlestick after a northward pullback and was followed through with bearish continuation prints a week later. However, the candlestick printed two weeks ago was bullish, indicating bulls were giving bears a tough fight. Last week, price action printed a doji-like candlestick around an S/R zone but it is not within the mean area and so we may have to wait for a further upward pullback or sideways operation for the mean reversion zone to be activated. A likely area for a bearish turnaround is the monthly pivot, around the 0.72060 area.
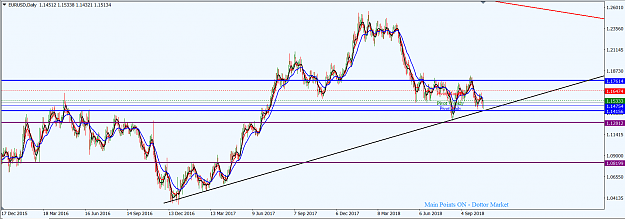
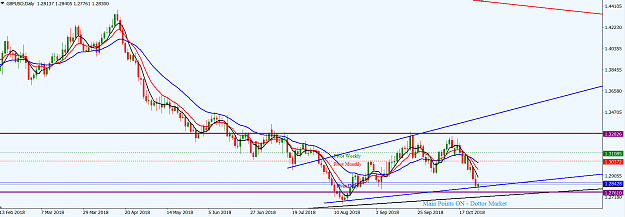
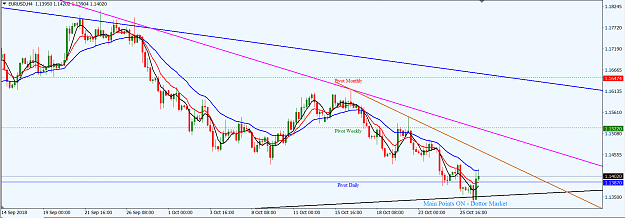
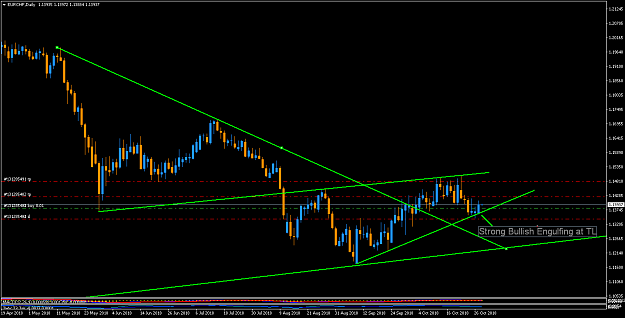
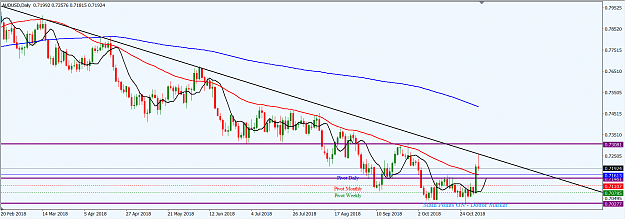
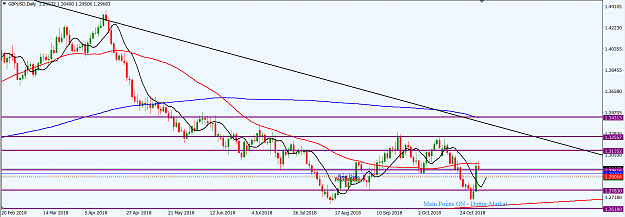
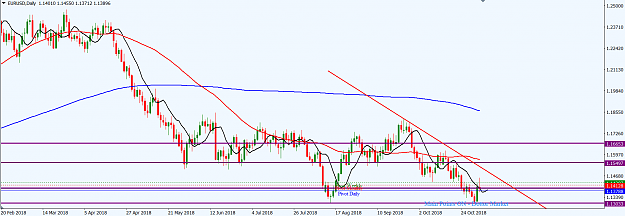
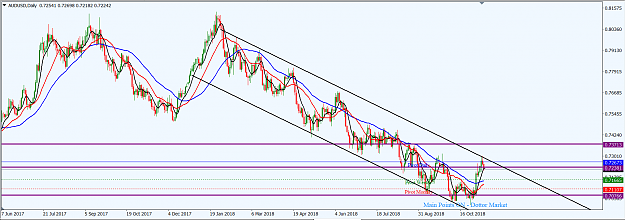
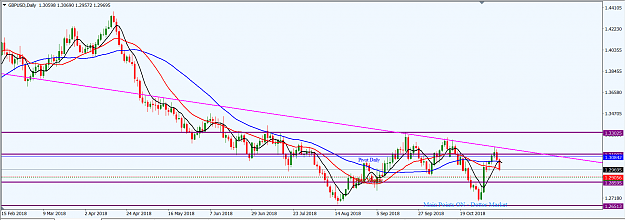
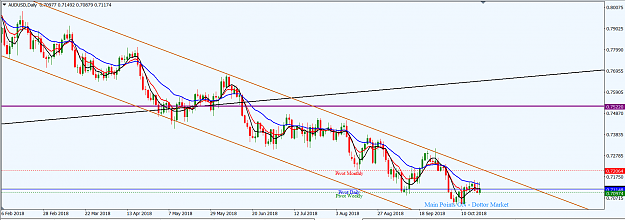
On the daily time frame, price action is rotating upwards in a descending channel (chocolate). Based on the technical pattern on the daily time frame, we may see a period of sideways operation or a slight bullish move towards the channel resistance before a southward turnaround. At any rate, we are likely to see the channel resistance hinder further northward move. I am bearish AUDUSD. But I will wait for price action to give me a clear bearish setup, perhaps around the channel resistance or the monthly pivot (around 0.72060).
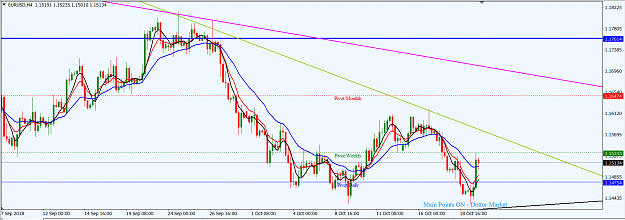
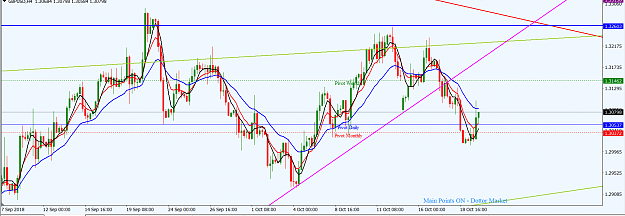
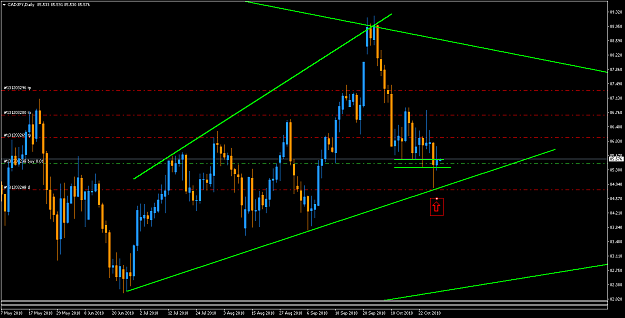
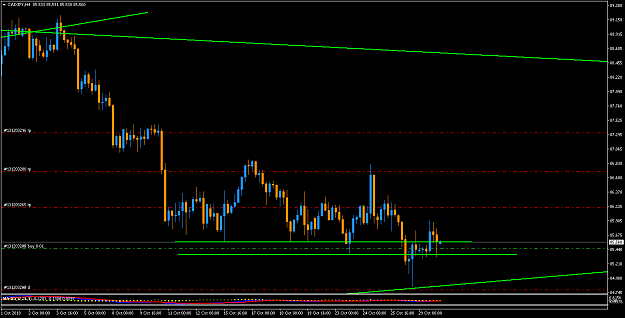
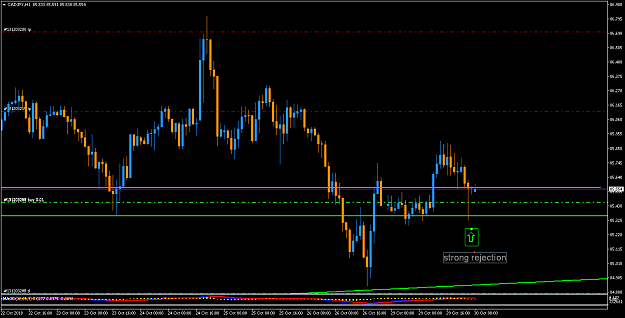
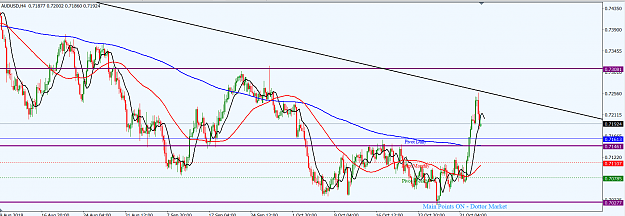
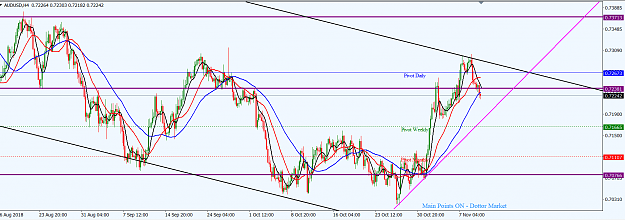
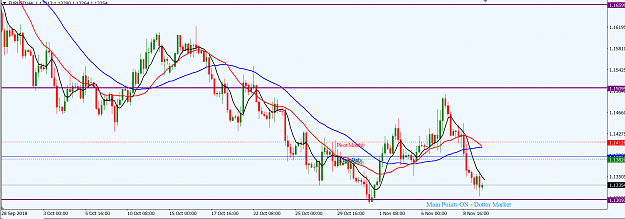
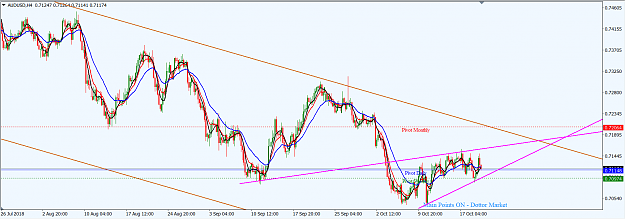
On the H4 time frame, price action is operating within an ascending flag pattern (magenta); a bearish potential in the context of the daily and weekly technical outlook. But it will take a a breakdown of the flag for a southward momentum to materialize.
I may be wrong. Trade safe and prosper.
KP
The downward move on the AUDUSD market that started upon the break of the ascending channel (black) in June 2018 has not seen significant momentum. On the weekly time frame, even though the market is still disposed southward, there has been a series of northward corrections. Four weeks ago, price action printed a bearish candlestick after a northward pullback and was followed through with bearish continuation prints a week later. However, the candlestick printed two weeks ago was bullish, indicating bulls were giving bears a tough fight. Last week, price action printed a doji-like candlestick around an S/R zone but it is not within the mean area and so we may have to wait for a further upward pullback or sideways operation for the mean reversion zone to be activated. A likely area for a bearish turnaround is the monthly pivot, around the 0.72060 area.
Attached Image (click to enlarge)
On the daily time frame, price action is rotating upwards in a descending channel (chocolate). Based on the technical pattern on the daily time frame, we may see a period of sideways operation or a slight bullish move towards the channel resistance before a southward turnaround. At any rate, we are likely to see the channel resistance hinder further northward move. I am bearish AUDUSD. But I will wait for price action to give me a clear bearish setup, perhaps around the channel resistance or the monthly pivot (around 0.72060).
Attached Image (click to enlarge)
On the H4 time frame, price action is operating within an ascending flag pattern (magenta); a bearish potential in the context of the daily and weekly technical outlook. But it will take a a breakdown of the flag for a southward momentum to materialize.
Attached Image (click to enlarge)
I may be wrong. Trade safe and prosper.
KP
Do your homework, follow the footprints of smart money