Bionic Dashboard currency strength
Hello dear traders,
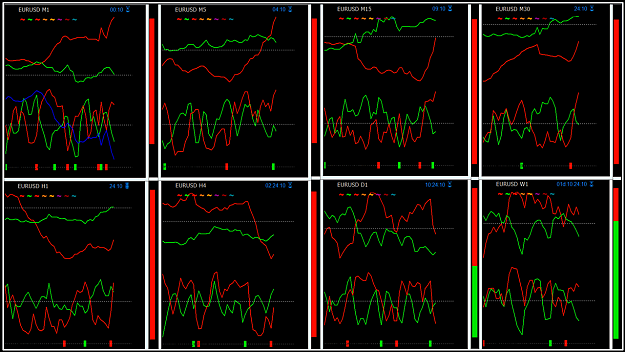
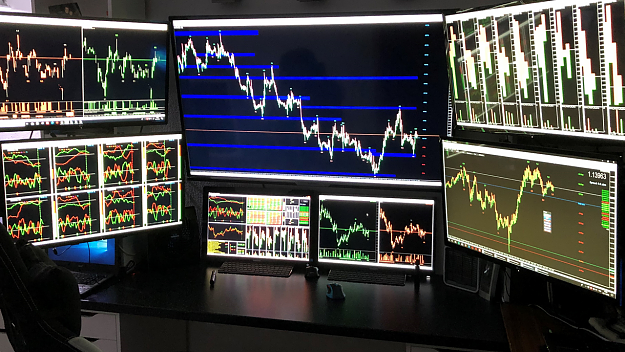
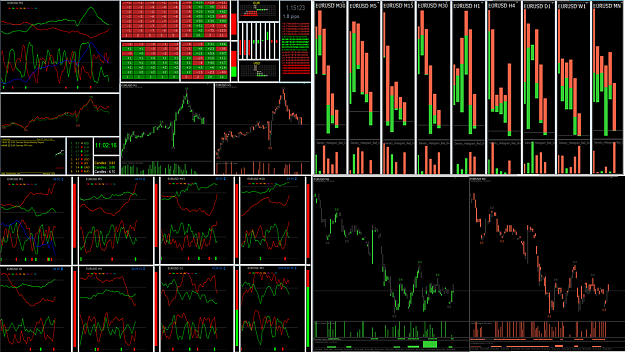
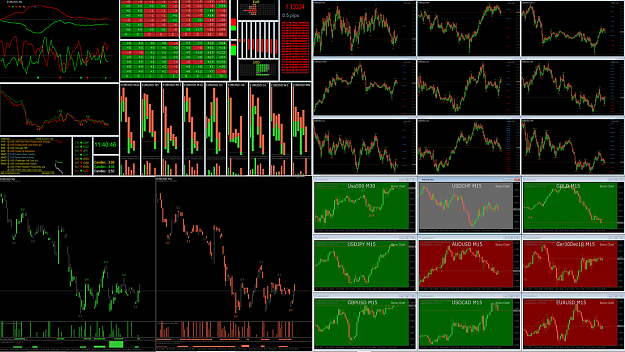
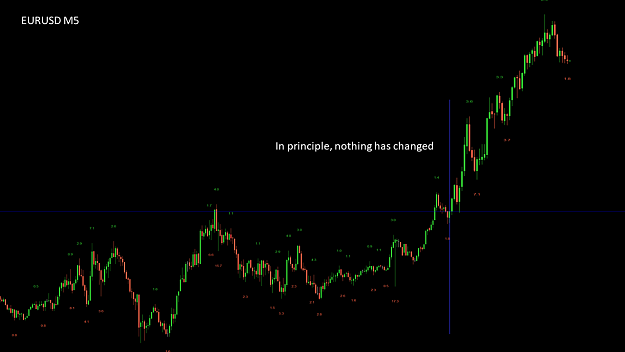
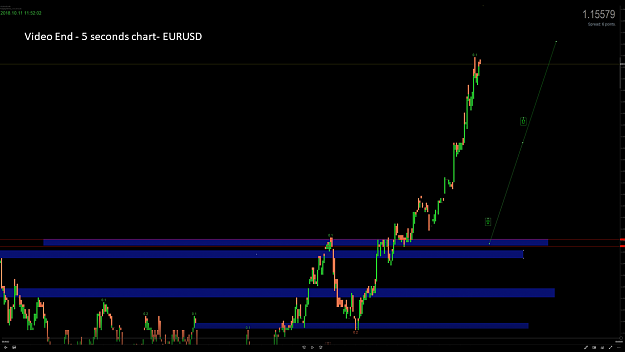
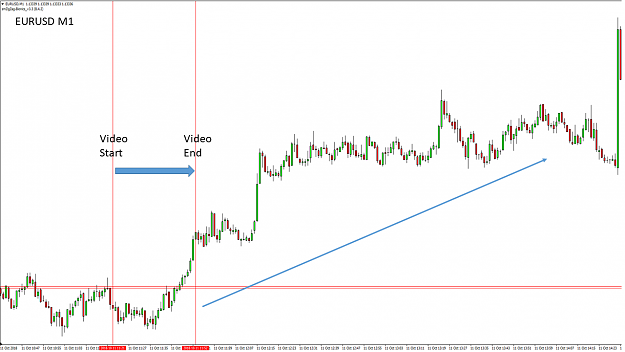
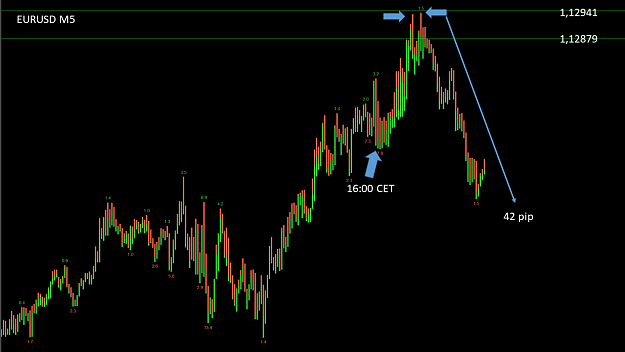
Today I would like to introduce you to another interesting dashboard in our project 3. This is primarily about the respective currency strength of the euro and the dollar. It is important to note that the currency strength indicators are influenced by the price, not the other way around. In addition, indicators are always lagging behind the current price. That's why I never recommend trading based on indicators. Nevertheless, you will receive interesting information from this type of compilation. Before we start, first take a look at how this dashboard looks in practice. The dashboard was recorded for 5 minutes on Friday at 14:31 CET. There was a high volatility. The course has risen first and then run down.
Let's take a closer look at the indicators
CCFp Indicator
Developer: SemSemFX
Interesting currency strength gauge
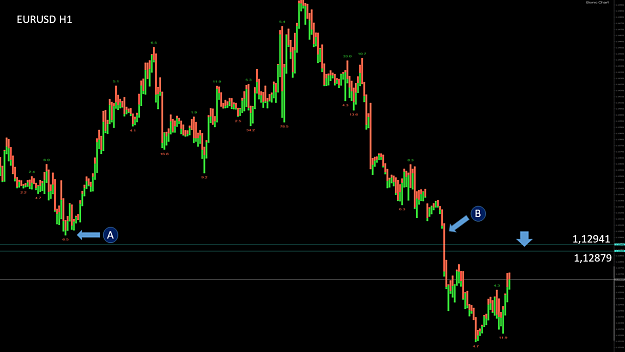
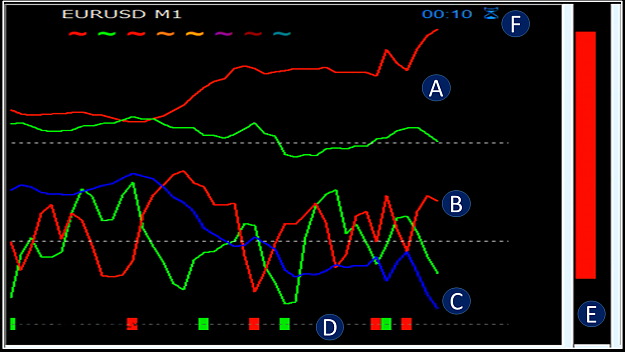
The indicator at point A indicates the strength in the euro with the green line and the strength of the dollar with the red line. It responds somewhat slower than the underlying currency strength indicator. The dashed white line is the zero line. If a currency lays over it is considered strong if it is lower than weak. However, this line also includes other currencies that were made invisible. Of course, you can compare all main currencies with each other.
+ RS_Group EUR & USD indicator
Developer: unknown
Very interesting strength indicator that can reacts faster than the price chart. Here, the EUR was currently compared with the dollar.
The currency strength indicator (point B) is a kind of currency basket where two different indicators, in this case the euro and the dollar indicate the current strength. This indicator responds very quickly to currency fluctuations and is therefore a nice confirmation to the upper indicator. In doing so, I made a very interesting observation that sometimes this indicator reacts faster than the price. The following situation: The red line of the dollar and the green line of the euro are both slowly going down. So we are in an equilibrium. Suddenly the green line shoots up. Which means that the euro will be much stronger against the dollar. A few seconds later, a bullish candle is created. I once tried to act for fun. This has worked a few times, but I strongly warn against doing it. This type of ad now takes some getting used to. If the green line is up and the red line down, it means we have a strength in the Euro and a weakness in the Dollar. That speaks for rising prices. If the red line is up and the green line is down, it means that we have a strength in dollars and a weakness in the euro. That speaks for falling courses. Since many of them also deal with other currency pairs, I have posted them at the end of the RS Group currency basket. There you will find the major currency strengths.
CFP indicator
Developer: SemSemFX
An indicator that gives almost the result of the euro and dollar strength.
The CFP indicator (point C) is, in principle, the result of the strength of the euro and the dollar. So it's a translation of the chart. If you compare this line with the price history they will realize that there are some differences. Since one can do without the indicator, I have installed it only once in the M1. However, it is certainly helpful for a start.
smZigZag-Bionic Oscilator
Developer: Bionic/SwingMan
Interesting trendindicator
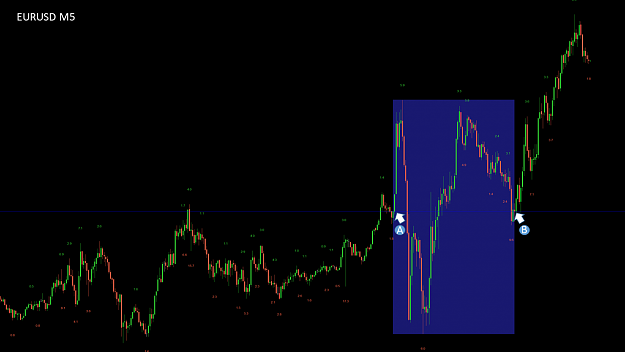
At point D you will find the Bionic Oscillator. As soon as a green dot emerges, the price could go up, as soon as a red dot appears, the price could run lower. Under no circumstances should you enter a trade in the creation of these red or green points. These points are generated from the zigzag indicator. This means that always the penultimate green or red dot is no longer changeable. Thus, the newly emerging point can actually only occur at a later date.
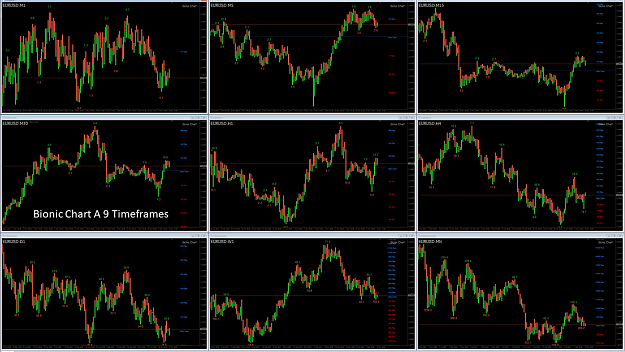
smZigZag-Bionic Chart
Developer: Bionic / SwingMan
Interesting new candle
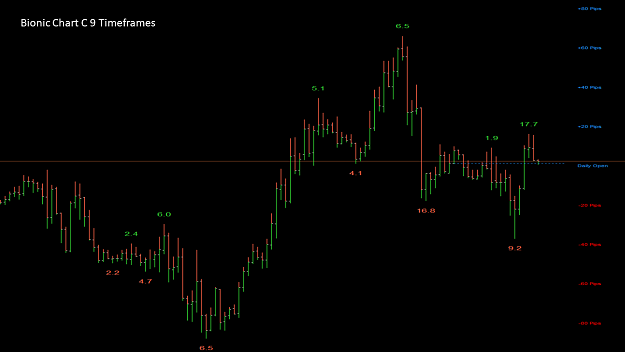
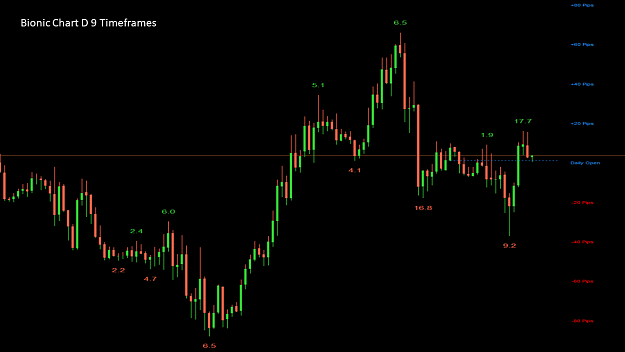
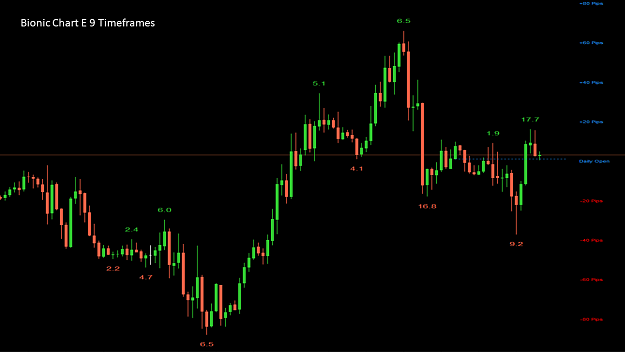
At point E, the Bionic Chart is a single current candle. This is actually only a small help to the overview.
At point F you will find a candle count-down, which shows you how long it will take until a new candle appears.
This dashboard consciously integrates all time units so they can choose their own time unit to focus on. As already described in Post 777, load the indicators into your MT4 and put the folder "8 Stärke CCFP Neu" in your folder: Profiles. After closing and reopening your MT4, you can now access this profile: "8 Stärke CCFP Neu ". Of course you can exchange the required currency strengths in this dashboard. The dashboard can be a good help now and then. Just install it and judge for yourself how the currency strength behaves during the day. As I said indicators are only an aid to get confirmed, what you already suspected.
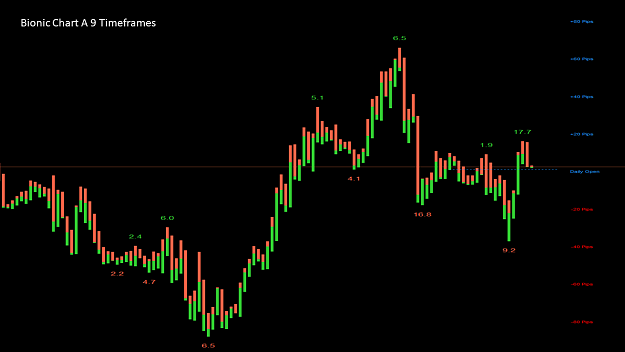
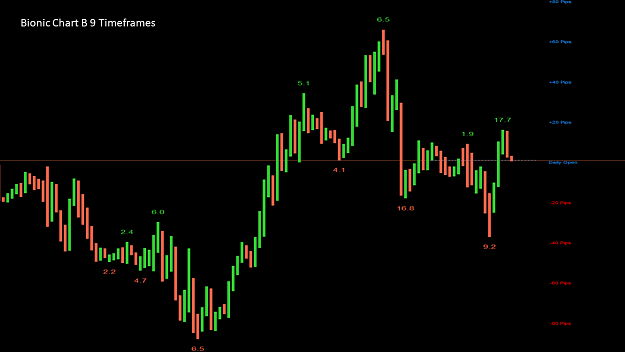
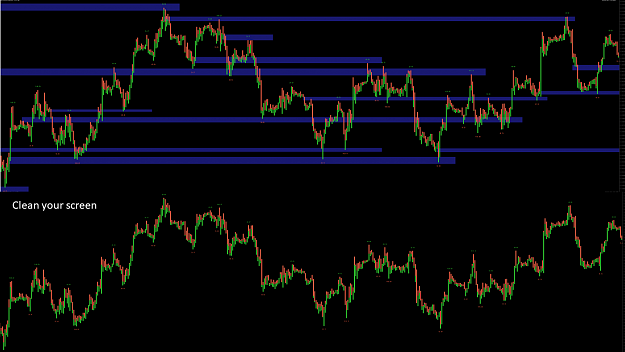
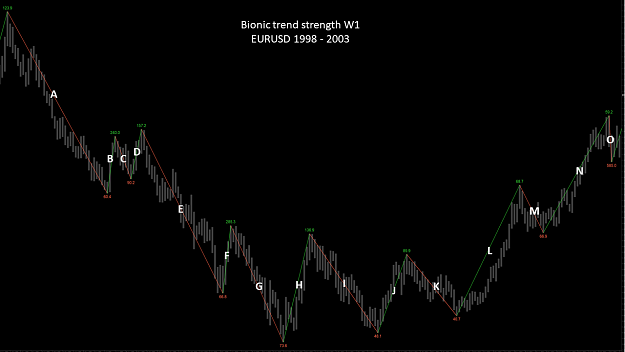
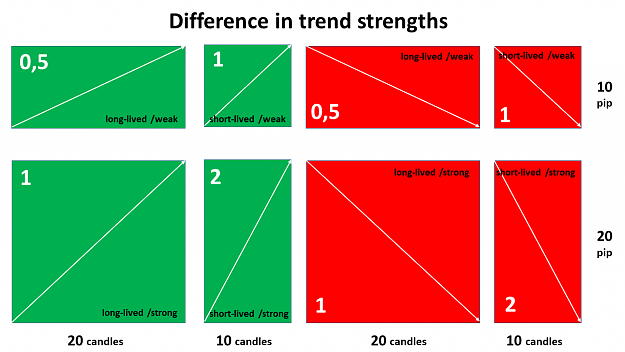
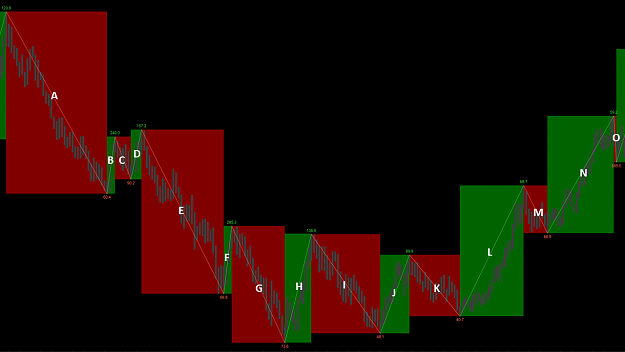
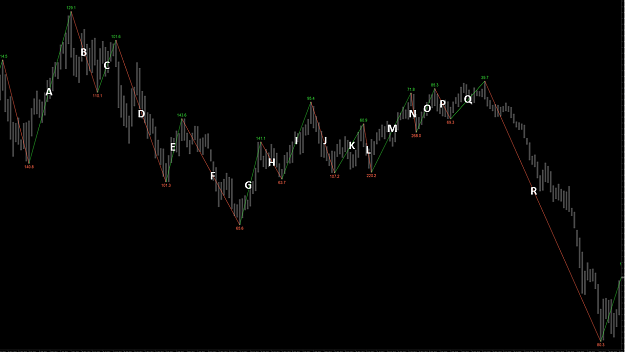
The project Dashboard will be completed next week. There are still missing the main chart images to determine the resistance. Additionally, I will post an analysis on the Bionic Trend Strength Indicator to explain the numbers above the turning points. The next project is already up and running and should bring us significantly ahead in terms of supply and demand.
I hope that you have further support here and I look forward to your feedback.
best regards
Hello dear traders,
Attached Image (click to enlarge)
Today I would like to introduce you to another interesting dashboard in our project 3. This is primarily about the respective currency strength of the euro and the dollar. It is important to note that the currency strength indicators are influenced by the price, not the other way around. In addition, indicators are always lagging behind the current price. That's why I never recommend trading based on indicators. Nevertheless, you will receive interesting information from this type of compilation. Before we start, first take a look at how this dashboard looks in practice. The dashboard was recorded for 5 minutes on Friday at 14:31 CET. There was a high volatility. The course has risen first and then run down.
Inserted Video
Let's take a closer look at the indicators
Attached Image (click to enlarge)
CCFp Indicator
Developer: SemSemFX
Interesting currency strength gauge
The indicator at point A indicates the strength in the euro with the green line and the strength of the dollar with the red line. It responds somewhat slower than the underlying currency strength indicator. The dashed white line is the zero line. If a currency lays over it is considered strong if it is lower than weak. However, this line also includes other currencies that were made invisible. Of course, you can compare all main currencies with each other.
+ RS_Group EUR & USD indicator
Developer: unknown
Very interesting strength indicator that can reacts faster than the price chart. Here, the EUR was currently compared with the dollar.
The currency strength indicator (point B) is a kind of currency basket where two different indicators, in this case the euro and the dollar indicate the current strength. This indicator responds very quickly to currency fluctuations and is therefore a nice confirmation to the upper indicator. In doing so, I made a very interesting observation that sometimes this indicator reacts faster than the price. The following situation: The red line of the dollar and the green line of the euro are both slowly going down. So we are in an equilibrium. Suddenly the green line shoots up. Which means that the euro will be much stronger against the dollar. A few seconds later, a bullish candle is created. I once tried to act for fun. This has worked a few times, but I strongly warn against doing it. This type of ad now takes some getting used to. If the green line is up and the red line down, it means we have a strength in the Euro and a weakness in the Dollar. That speaks for rising prices. If the red line is up and the green line is down, it means that we have a strength in dollars and a weakness in the euro. That speaks for falling courses. Since many of them also deal with other currency pairs, I have posted them at the end of the RS Group currency basket. There you will find the major currency strengths.
CFP indicator
Developer: SemSemFX
An indicator that gives almost the result of the euro and dollar strength.
The CFP indicator (point C) is, in principle, the result of the strength of the euro and the dollar. So it's a translation of the chart. If you compare this line with the price history they will realize that there are some differences. Since one can do without the indicator, I have installed it only once in the M1. However, it is certainly helpful for a start.
smZigZag-Bionic Oscilator
Developer: Bionic/SwingMan
Interesting trendindicator
At point D you will find the Bionic Oscillator. As soon as a green dot emerges, the price could go up, as soon as a red dot appears, the price could run lower. Under no circumstances should you enter a trade in the creation of these red or green points. These points are generated from the zigzag indicator. This means that always the penultimate green or red dot is no longer changeable. Thus, the newly emerging point can actually only occur at a later date.
smZigZag-Bionic Chart
Developer: Bionic / SwingMan
Interesting new candle
At point E, the Bionic Chart is a single current candle. This is actually only a small help to the overview.
At point F you will find a candle count-down, which shows you how long it will take until a new candle appears.
This dashboard consciously integrates all time units so they can choose their own time unit to focus on. As already described in Post 777, load the indicators into your MT4 and put the folder "8 Stärke CCFP Neu" in your folder: Profiles. After closing and reopening your MT4, you can now access this profile: "8 Stärke CCFP Neu ". Of course you can exchange the required currency strengths in this dashboard. The dashboard can be a good help now and then. Just install it and judge for yourself how the currency strength behaves during the day. As I said indicators are only an aid to get confirmed, what you already suspected.
The project Dashboard will be completed next week. There are still missing the main chart images to determine the resistance. Additionally, I will post an analysis on the Bionic Trend Strength Indicator to explain the numbers above the turning points. The next project is already up and running and should bring us significantly ahead in terms of supply and demand.
I hope that you have further support here and I look forward to your feedback.
best regards
Attached File(s)
Attached File(s)
Forget:That does not work, amateurs build the ark, pros the Titanic!
2