USDCAD Weekly Technical Outlook
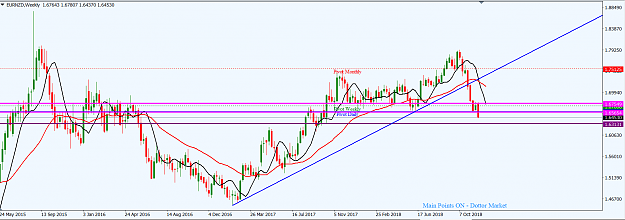
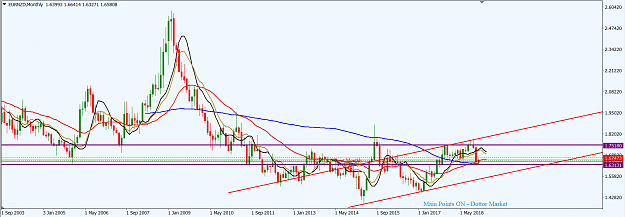
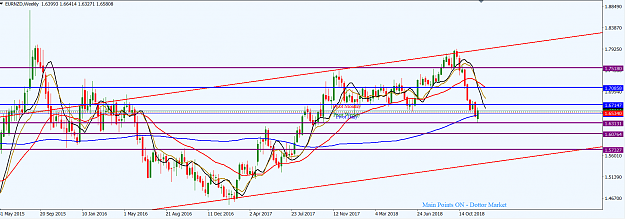
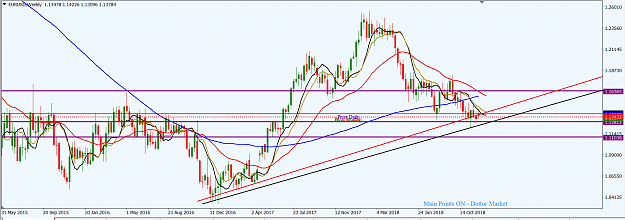
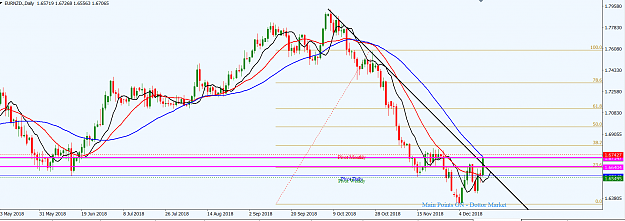
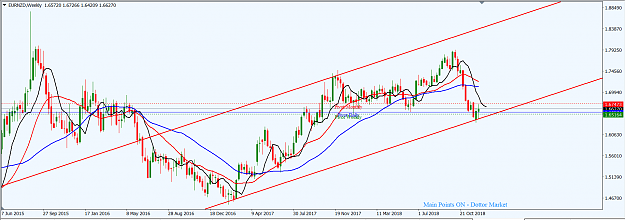
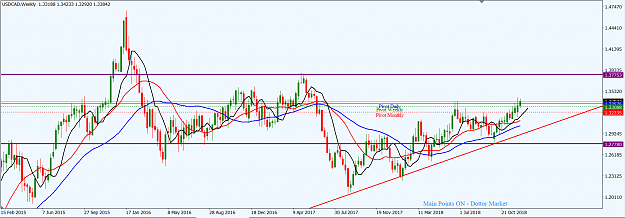
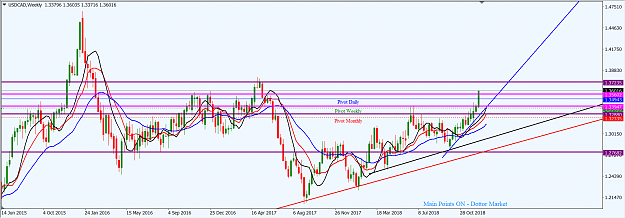
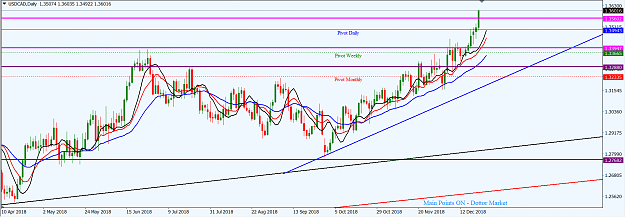
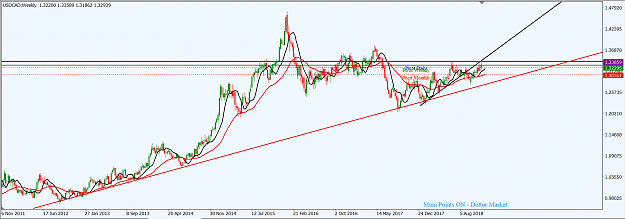
The USDCAD is operating a complex correction of a multi-year ascending trendline (red) on the weekly time frame traceable to 2012. An increase in bullish tone took price action above the trendline for much of 2018 to respect an inner ascending trendline (black), which was broken southwards in mid-August 2018. Price action is now heading northwards but apparently the momentum is waning and we may soon see a southward turnaround, somewhat of a temporary correction, which may retest the major ascending trendline (red) before a northward continuation. The 1.33860 area is a horizontal resistance and a significant horizontal support is around the 1.27890 area.
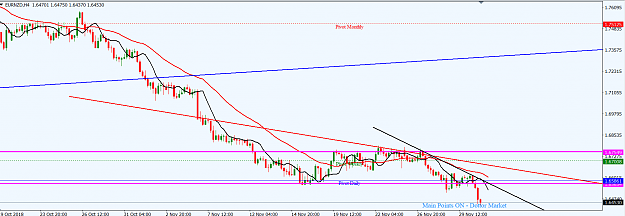
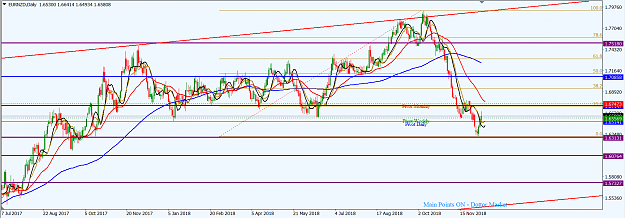
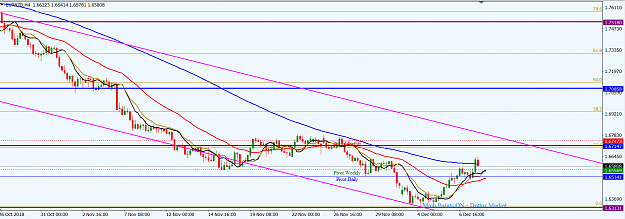
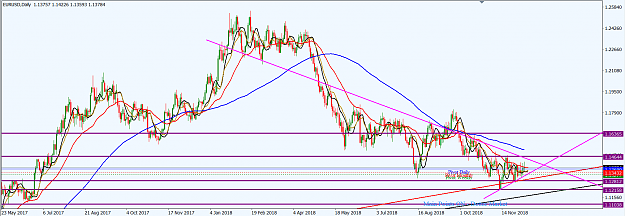
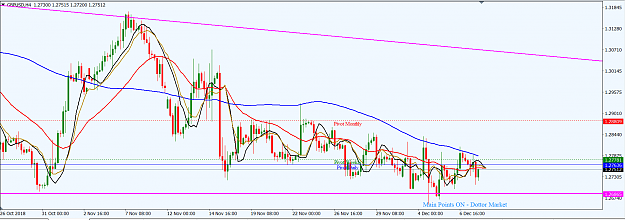
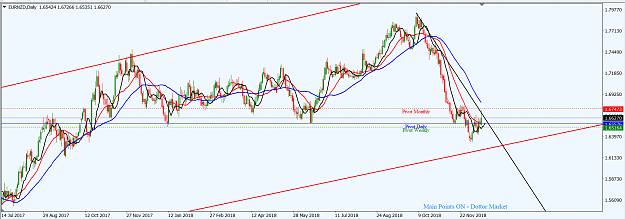
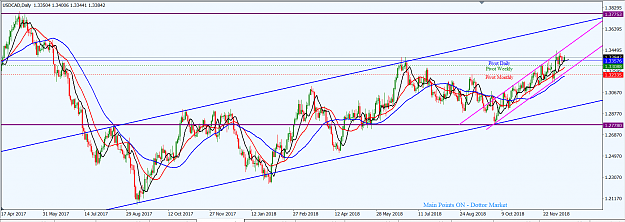
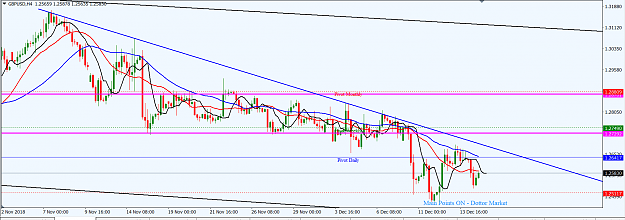
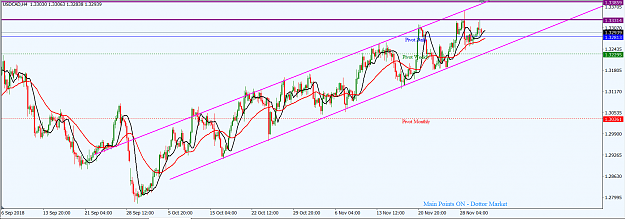
On the H4 time frame, price action is consolidating along an ascending channel (magenta). Last week Thursday, price action moved northwards into a horizontal resistance area around 1.33315/1.33860, which has held since June 2018, but was restrained by bears. Technically, we can expect another attempt at the zone by bulls and a sideways operation may be seen in the zone in the early part of this week. As I hold a bullish sentiment on this market, I will wait for a southward pullback to an area of value and look for a significant bullish setup on a daily time frame before entering the market.
I may be wrong. Trade safe and prosper.
KP
The USDCAD is operating a complex correction of a multi-year ascending trendline (red) on the weekly time frame traceable to 2012. An increase in bullish tone took price action above the trendline for much of 2018 to respect an inner ascending trendline (black), which was broken southwards in mid-August 2018. Price action is now heading northwards but apparently the momentum is waning and we may soon see a southward turnaround, somewhat of a temporary correction, which may retest the major ascending trendline (red) before a northward continuation. The 1.33860 area is a horizontal resistance and a significant horizontal support is around the 1.27890 area.
Attached Image (click to enlarge)
On the H4 time frame, price action is consolidating along an ascending channel (magenta). Last week Thursday, price action moved northwards into a horizontal resistance area around 1.33315/1.33860, which has held since June 2018, but was restrained by bears. Technically, we can expect another attempt at the zone by bulls and a sideways operation may be seen in the zone in the early part of this week. As I hold a bullish sentiment on this market, I will wait for a southward pullback to an area of value and look for a significant bullish setup on a daily time frame before entering the market.
Attached Image (click to enlarge)
I may be wrong. Trade safe and prosper.
KP
Do your homework, follow the footprints of smart money
2