Hi Ata,
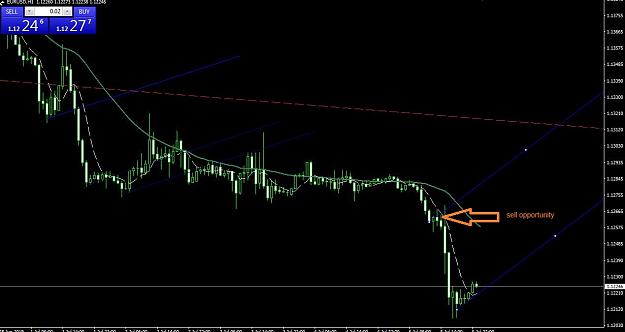
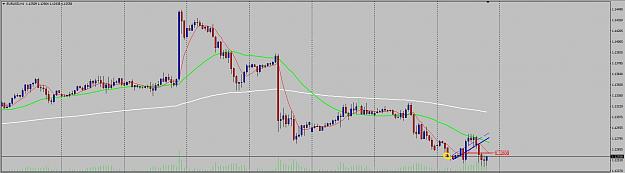
Didn't want to clog the EURUSD thread with this question regarding the system. Please have a look at the BLUE TL that i have drawn on my chart. I had marked out 1260 area as a sell zone after the breakout candle as seen on my chart, and i had a sell order placed there. However, once London opened, I faced a 25 pip drawdown (my SL was 30 pips), and i luckily managed to come out with 10 pips profit after the drop came.
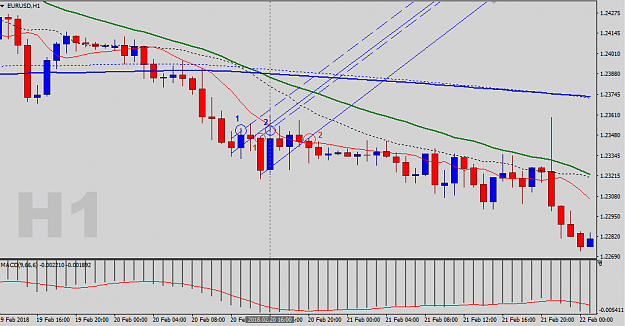
I also noticed that on the chart you posted on EURUSD, your BLUE TL was placed on a different red-blue candle couple - the couple marked out in the yellow circle. The reason why i had drawn my BLUE TL where i had drawn them on my chart is because i saw a lower close on the bearish candle compared to the bearish candle in the yellow circle. My question is this - did I draw the BLUE TL on the wrong candle couple according to your system, or was this a correct entry according to the system and just a situation whereby i had to face larger than usual drawdown?
Thank you for your time!
Didn't want to clog the EURUSD thread with this question regarding the system. Please have a look at the BLUE TL that i have drawn on my chart. I had marked out 1260 area as a sell zone after the breakout candle as seen on my chart, and i had a sell order placed there. However, once London opened, I faced a 25 pip drawdown (my SL was 30 pips), and i luckily managed to come out with 10 pips profit after the drop came.
I also noticed that on the chart you posted on EURUSD, your BLUE TL was placed on a different red-blue candle couple - the couple marked out in the yellow circle. The reason why i had drawn my BLUE TL where i had drawn them on my chart is because i saw a lower close on the bearish candle compared to the bearish candle in the yellow circle. My question is this - did I draw the BLUE TL on the wrong candle couple according to your system, or was this a correct entry according to the system and just a situation whereby i had to face larger than usual drawdown?
Thank you for your time!
Attached Image (click to enlarge)
Go with the flow