Hi everyone,
Is it possible to plot data from the data window on to the chart, using an indicator? And update those values depending on which candle my mouse pointer is?
The reason I ask is:
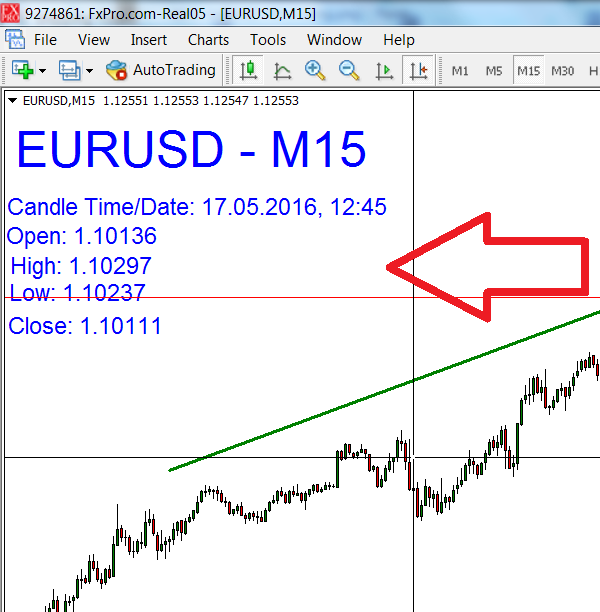
I have a large screen monitor and when I want to check the High/Low/Open/Close values of a candle, I always have to squint my eyes looking at the numbers either in the status bar or in the DataWindow, which gets tiring. It would be great if an indicator took the High/Low/Open/Close values of any candle (not just the current or last candle) I'm hovering over with my mouse (just like with the data window) and display it in LARGE letters on my MT4 screen.
Basically: take DataWindow values (High/Low/Open/Close) and plot them on chart, with big font size/letters. Or you could say..data from the DataWindow, but in larger letters, plotted on the chart.
Is this possible?
Here's an example of how I imagine it would look like (I used text labels):
Attached Image

