Anyone interested in discussing DJ30 particularly scalping intra-day and swing trading 2 to 3 days trading?
DJ INDEX CFD and/or DJ FUTURES traders welcome!
Looking to discuss scalps and intra day trades. Also open to discussing various methodology thoughts/ideas on analyzing the DJ30 market for short term trading.
********************
********************
Disclaimer:
By following this thread/forum, reading contents of this thread/forum or participating in this thread/forum, you agree and understand that:
(1) ABSOLUTELY NO INVESTMENT ADVICE OR TRADING ADVICE IS GIVEN, GRANTED OR STIPULATED by any and all posters on this thread.
(2) You also understand and agree that ultimately NO ONE BUT YOURSELF IS RESPONSIBLE FOR ANY TRADING LOSS or LOSSES and/or any other financial loss that you may incur trading instruments discussed on this thread/forum.
(3) YOU UNDERSTAND AND AGREE THAT ANY CONTENT AND/OR DISCUSSION ON THIS THREAD IS EXPRESSLY FOR ENTERTAINMENT (AND EXPRESSING PERSONAL VIEWPOINTS) AND/OR FOR THE PURPOSE OF ACQUIRING GENERAL KNOWLEDGE ONLY.
(4) You also agree to not slander or harass posters on this thread. Any inappropriate remarks and/or posts will be reported to ForexFactory.com.
********************
********************
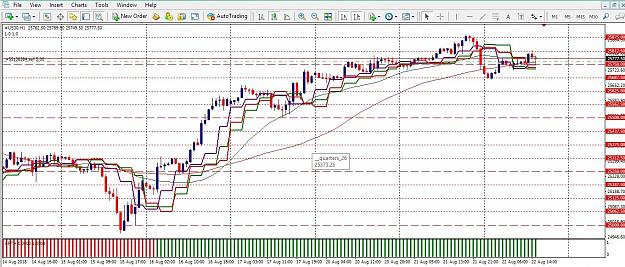
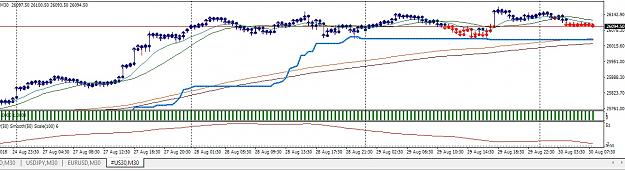
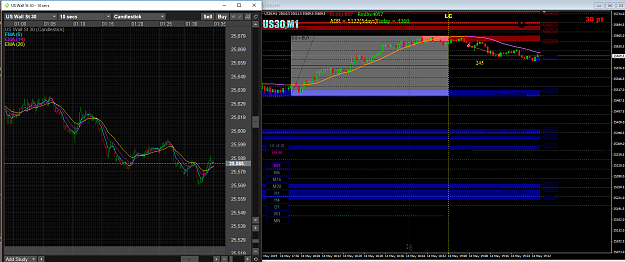
I'm currently trading the DJ30 index CFD (not futures) through a retail FX broker on the MT4 platform.
Average spread is 5 pips (4.5 pips).
1 DJ30 point equals $1 U.S. Dollar per 1.00 contract lot, for example a move from 25,750 to 25,751.
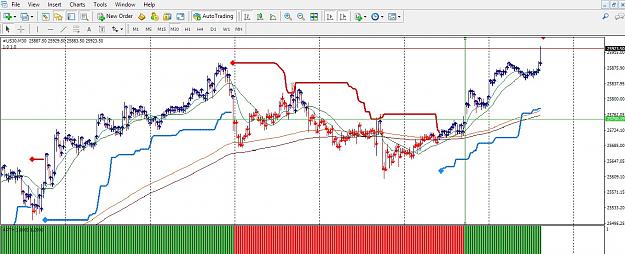
A long time ago I used to sporadically trade the D30 index and futures and am now returning to it (live forward trading/testing it). The CFD tracks very well on even a one minute chart and with the high index price there is very good daily range and volatility.
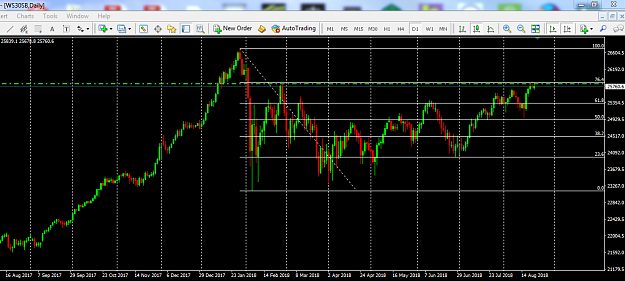
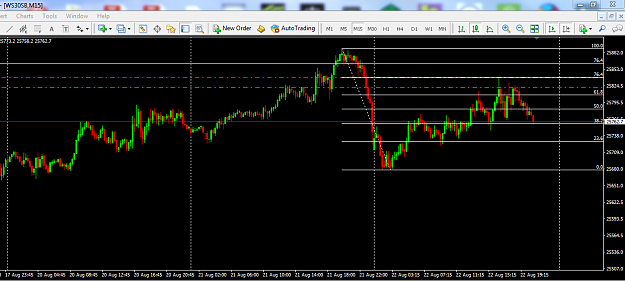
The mass media is starting to get a little frothy on the bullishness of the market so I'm expecting a big 2000 point plus retracement to the downside (which is still less than a 8 percent move down) in the near future.
However, for the short term day by day now, until the big bad political/financial/global event hammer falls I'm thinking at this moment that the market may attempt to creep up to test and possibly exceed the recent highs...it all depends on how investors absorb the political surprises that seem to be getting more intense. Yesterday's late price action was interesting, the news spooked some folks out but also there was some profit taking at the highs as well.
I don't have Level 2 quotes and pricing so I don't know the bid/offers and size on the component stocks. So in a way I am trading blind but will see how this plays out. Of course, following a few key components such as AAPL and KO etc.
First question for any takers... I want to see a ratio of DJIC vs DJIA and be able to track it in real time or at least eval it to see if there is any edge in tracking it.
Is anyone aware of any sites that has this figure OR has anyone ever tried tracking it?
For example, DJI Composite at yesterday's NY close at around 8722 and the DJIA at around 25822 would be 8722/25822 which would be 0.33777.
I want to see this ratio in real time and see if there is an edge in tracking it. Any ideas without getting a 3rd party live 24 hour index data feed and API?
I know there are other ratios like NAS vs DOW and DOW VS. GOLD. Anyone track these as well?
General comments?
DJ INDEX CFD and/or DJ FUTURES traders welcome!
Looking to discuss scalps and intra day trades. Also open to discussing various methodology thoughts/ideas on analyzing the DJ30 market for short term trading.
********************
********************
Disclaimer:
By following this thread/forum, reading contents of this thread/forum or participating in this thread/forum, you agree and understand that:
(1) ABSOLUTELY NO INVESTMENT ADVICE OR TRADING ADVICE IS GIVEN, GRANTED OR STIPULATED by any and all posters on this thread.
(2) You also understand and agree that ultimately NO ONE BUT YOURSELF IS RESPONSIBLE FOR ANY TRADING LOSS or LOSSES and/or any other financial loss that you may incur trading instruments discussed on this thread/forum.
(3) YOU UNDERSTAND AND AGREE THAT ANY CONTENT AND/OR DISCUSSION ON THIS THREAD IS EXPRESSLY FOR ENTERTAINMENT (AND EXPRESSING PERSONAL VIEWPOINTS) AND/OR FOR THE PURPOSE OF ACQUIRING GENERAL KNOWLEDGE ONLY.
(4) You also agree to not slander or harass posters on this thread. Any inappropriate remarks and/or posts will be reported to ForexFactory.com.
********************
********************
I'm currently trading the DJ30 index CFD (not futures) through a retail FX broker on the MT4 platform.
Average spread is 5 pips (4.5 pips).
1 DJ30 point equals $1 U.S. Dollar per 1.00 contract lot, for example a move from 25,750 to 25,751.
A long time ago I used to sporadically trade the D30 index and futures and am now returning to it (live forward trading/testing it). The CFD tracks very well on even a one minute chart and with the high index price there is very good daily range and volatility.
The mass media is starting to get a little frothy on the bullishness of the market so I'm expecting a big 2000 point plus retracement to the downside (which is still less than a 8 percent move down) in the near future.
However, for the short term day by day now, until the big bad political/financial/global event hammer falls I'm thinking at this moment that the market may attempt to creep up to test and possibly exceed the recent highs...it all depends on how investors absorb the political surprises that seem to be getting more intense. Yesterday's late price action was interesting, the news spooked some folks out but also there was some profit taking at the highs as well.
I don't have Level 2 quotes and pricing so I don't know the bid/offers and size on the component stocks. So in a way I am trading blind but will see how this plays out. Of course, following a few key components such as AAPL and KO etc.
First question for any takers... I want to see a ratio of DJIC vs DJIA and be able to track it in real time or at least eval it to see if there is any edge in tracking it.
Is anyone aware of any sites that has this figure OR has anyone ever tried tracking it?
For example, DJI Composite at yesterday's NY close at around 8722 and the DJIA at around 25822 would be 8722/25822 which would be 0.33777.
I want to see this ratio in real time and see if there is an edge in tracking it. Any ideas without getting a 3rd party live 24 hour index data feed and API?
I know there are other ratios like NAS vs DOW and DOW VS. GOLD. Anyone track these as well?
General comments?