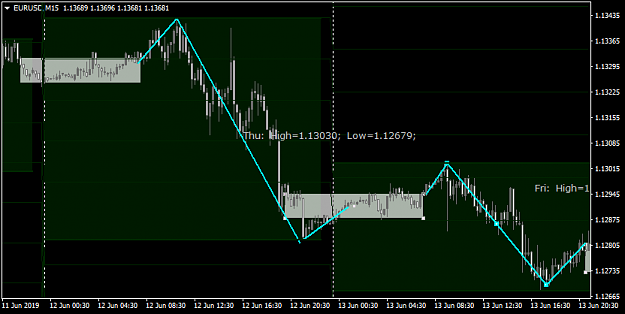
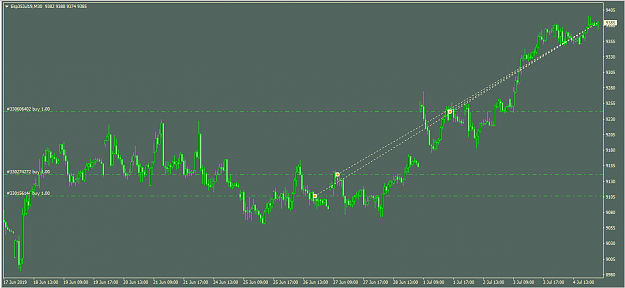
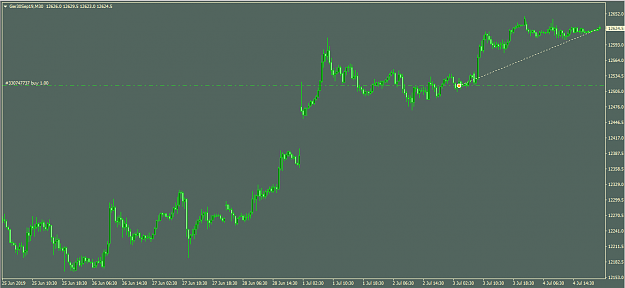
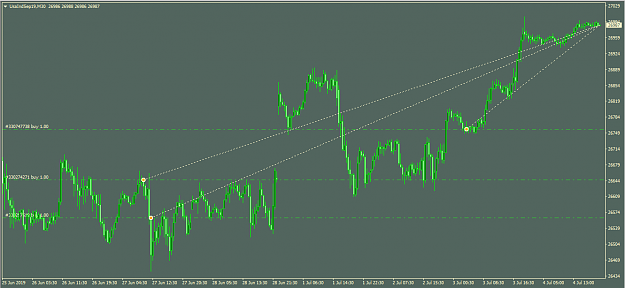
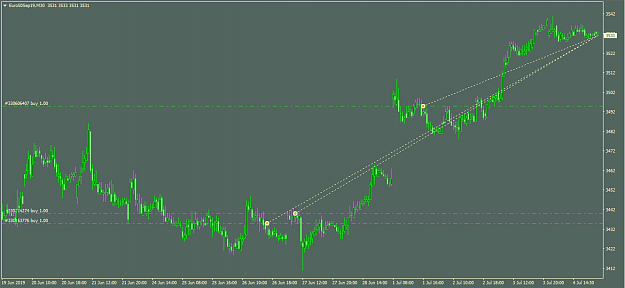
Jagg, here is the analysis on DAX I don't have price data for Dow at the moment. {image}
Ignored
Thanks! So as my forward tests/statistics show here earlier in the thread DAX is also a very good candidate for this method (shows nearly similar statistic chart like your AUDUSD image)
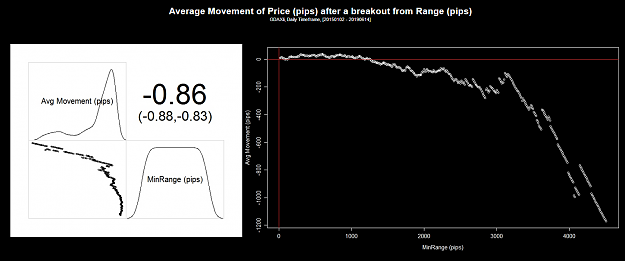
I did some statistical analysis of price movement after a breakout of x pips from the daily range. Negative values means the price retraced on average. Positive values means the price continued in the same direction of the move. here is the result for EURUSD; from 2011 todate. Some observations from the chart: - There is a negative correlation between the day's range and retracement; which means; the larger the value; the more likely it will retrace - On average; EURUSD reverses course after a 150 pips of daily range; which is interesting to know....
Ignored
So the Average reversal over the 150pip ATR is less than 20%?
Right. Just interesting that it's such a small percentage reversion. Speaks to me of the margin of inefficiency/volatility in the market. It's an interesting point.
Side thought..
Could we work backward from that average and figure out which mean it is respecting/reverting to and draw it?
I have another point on that about market structure.. but I am working on another way to show it. I'm good with ideas.. bad with words and pictures. ha
Right. Just interesting that it's such a small percentage reversion. Speaks to me of the margin of inefficiency/volatility in the market. It's an interesting point. Side thought.. Could we work backward from that average and figure out which mean it is respecting/reverting to and draw it? I have another point on that about market structure.. but I am working on another way to show it. I'm good with ideas.. bad with words and pictures. ha
Ignored
Keep in mind that the context of the study above is we enter at the specified range, then exit at EOD.
another way of looking at this, is to study the excursions after the breakout, measure the average retracements.
those retracements is where the edge might be, because the strategy discussed in this thread, exits intraday.
shoot your ideas, and lets see where we can go.
it is important to do the studies that finds the edge.
I attached pictures to explain something and I think with your smarts, you can make something out if it.
Every day has a structure to it, and I bet you could do a scan for the percentage of days that follow the structure very closely. It's definitely the majority if not practically all days. And there is a good reason.
This structure encompasses and contains pretty much all of the concepts talked about so far in this thread.
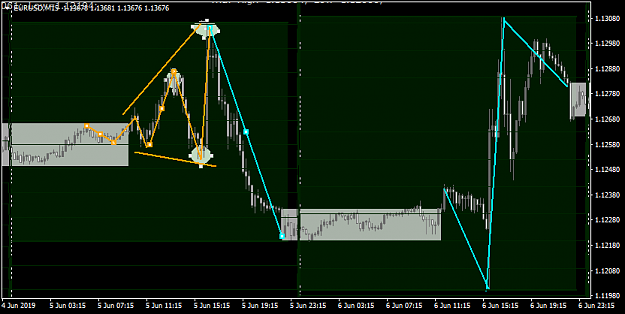
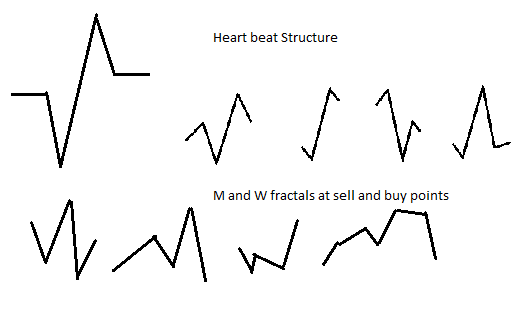
Principle 1 Every day the market forms what looks like a heart beat wave. And between each day there is a period of consolidation. (see structure.jpg)
The reason every day forms one of the variations, is because that is what a candle looks like.
There are only so many different candles. They all fit into 7 basic categories, but assuming I didn't forget one.. they all really fit into 4 bars because 3 are the same just the inverse. Also.. if you think about it.. it is easy to identify by drawing a line at the top quarter of the bar, and a line at the lower quarter of the bar. The open and close are just variations of being in one of these three sections. (see candles.jpg)
So.. all of the candle within a candle stuff.. fractals of time and price movement, Atr of different structures, interplay in these 2 concepts.
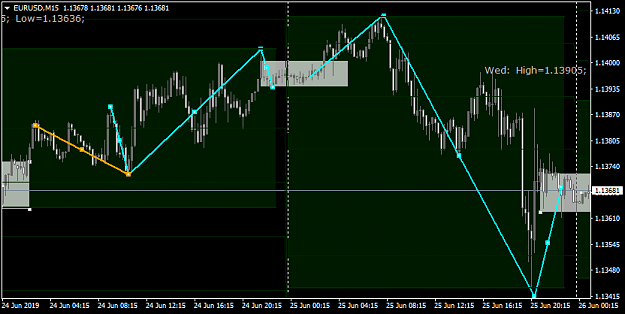
Picture 1 and picture 2 show how easy it is to find this structure every day.
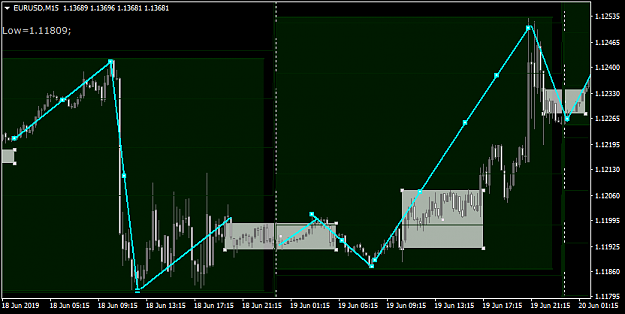
picture 9 and 10 I had to look for and are harder days to see, but they are still very tradeable as you can see.
There are many many conclusions to be drawn from this very simple way of seeing the market for what it really is.
If you want just some of my ideas.. it would be like this..
Every day the market cannot keep moving. People rest.. it has to rest.. banks don't push the market 24 7 because they need the market to bounce around so they can accumulate and distribute their volume. Also.. there is time between the trading sessions where things die down. So you can see the consolidation on the daily cycle happens at about the same time every day and this resets the market structure the majority of the time.
Market maker and bank behavior is clearly seen without even using volume! They consolidate.. stop hunt, push the market, take profit, it retraces, consolidates.. and does it all over again the next day. This is all reflected in each daily candle and the daily fractal structure builds into their larger position moves.
M and W formations can be seen on the smaller fractal levels and on any time frame. They always happen at reversal points in the heart beat structure. So you can see them coming.
What the AO system got right.. is that the banks usually move the market in relation to HOD and LOD of either the current day, or the previous 1-3 days. Why? Because they stop hunting and absorbing positions so they can move the market.
What does this tell us? I'm sure you guys already see it.. but that first wave out of consolidation is almost never what we are trading. sort wave, long wave, short wave. We want to trade the longer waves.
So alphadude, you can see where your info factors in right? I mean.. if I read what you wrote correctly. After a long leg that extended the range.. you statistically showed what the last return wave of the heartbeat structure is before EOD right? If you can do that.. I believe you have the capability to show how to filter the beginning impulse wave, to catch the major heartbeat move.
I don't cherry pick stuff.. that orange expanding wave is all we really need to be able to trade effectively.
I noticed the consolidation period is always somewhat relational to a % of the daily ATR. I used a daily atr grid set at 14 and .2. So each line is .2 of the daily ATR.
I noticed that the wave that forms the first small wave of the heartbeat can bounce around, but the actual first leg will be between 1 and 2x the width of the consolidation and at least .2 of the daily ATR. I think with your smarts, you can test to see which ratios and fractions are most ideal, and we can construct a system that self adapts. The trickiest part will be automating the consolidation range accurately. If that is drawn too big or too small due to automated inefficiency, it would be off.
We need to filter the wave size, and focus on testing and stop hunting the highs and lows of the consolidation and or the HOD LOD. They are typically in the same areas, but not always, and a statistic to show the strength of convergence, if any, would help.
The ramifications are pretty deep in regards to the fractal rabbit hole of all of that, and how you could auto trade.. but hopefully that all made sense and was pretty simple to see.
So.. what do you guys think? Want to work together on it?
I attached pictures to explain something and I think with your smarts, you can make something out if it. Every day has a structure to it, and I bet you could do a scan for the percentage of days that follow the structure very closely. It's definitely the majority if not practically all days. And there is a good reason. This structure encompasses and contains pretty much all of the concepts talked about so far in this thread. Principle 1 Every day the market forms what looks like a heart beat wave. And between each day there is a period of consolidation....
I attached pictures to explain something and I think with your smarts, you can make something out if it. Every day has a structure to it, and I bet you could do a scan for the percentage of days that follow the structure very closely. It's definitely the majority if not practically all days. And there is a good reason. This structure encompasses and contains pretty much all of the concepts talked about so far in this thread. Principle 1 Every day the market forms what looks like a heart beat wave. And between each day there is a period of consolidation....
Ignored
There is a simple answer to your questions; checkout this thread about "London close strategy". It does exactly what you are asking for. It fades the day range; but at specific time of day; when consolidation is expected; and also it fades it at the extreme points.
Thanks. I'm familiar with the strategy. Kind of forgot about it though. Except for that guy's youtube commercials about the London Daybreak strategy. haha. I mean.. I guess if simple works.. But I think I would rather filter and have tight stops and not fade if I don't have to. Maybe it's a personal hang up, but I think I would rather be right, than guess.. but maybe that is idealism. My other hobby is tinkering with random entry systems to still make money. so.. anyway
Also though.. and probably the biggest reason.. is you can scale the concept up or down, and not just fade a daily movement, but larger and lower fractals. The consolidation happens on the one hour chart and is a similar structure but different. But scalping and building up into the larger movements might actually be the safest and most effective.
Lastly.. what was AO's original method if not scaling/trying to fade into trades?
So it really just depends which way you guys want to take it.. if any.
It looks like you could take this concept, slap AO's system and some better money management into it and it would work pretty flawlessly.
If you could slap fractal recognition into it and building into larger candles somehow.. that would be pretty next level. But that would be a pretty long project.
So I guess the question is, where do you want the thread to go? Do we want to build something that works and exit the way that those earlier in the thread did, when they figured it out.. or.. is it dead?
Thanks @parisboy. I'm actually a big fan of your channel stuff. I think it's a very effective way to trade.
I read a similar book quite a few years ago. I could geek out with you all day long about patterns and stuff. I've forgotten most of it, so it will be a fun read. Honestly though, why I stopped, is because at the time.. I found that volume and order flow is all that moves the market. People act in predictable patterns, and will until everyone figures out volume and they have to switch their money grabbing methods. Long story short.. I didn't need all the patterns, and it just cluttered my chart. In other words.. if I know price is going to bounce here.. and if it does.. it goes to point B, if it doesn't it goes to point C.. then I just trade those and don't get caught in the middle. You know?
I could see a value in auto pattern recognition and building that into smaller time frames on a scalping basis. Because price moves too fast at that level to analyze 10 different patterns on multiple pairs. I can pretty much trade naked. Add volume and I can tell you exactly what's going on in the market. Pattern recognition, in my experience and opinion, is best used for probability analysis and mechanically trading in an auto system if you want added levels of complexity.
Range and trend really don't matter in the scheme of things. All we really need is for the market to move. We just want to predictably catch a set or predictably variable movement. I think your envelopes do a good job of doing that.
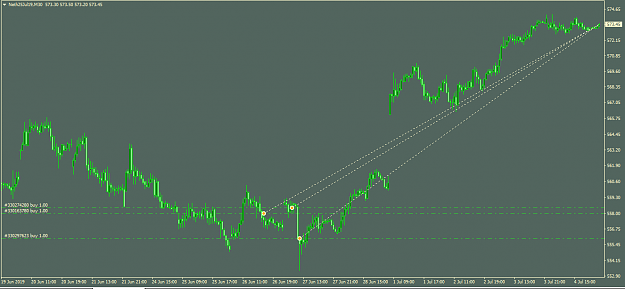
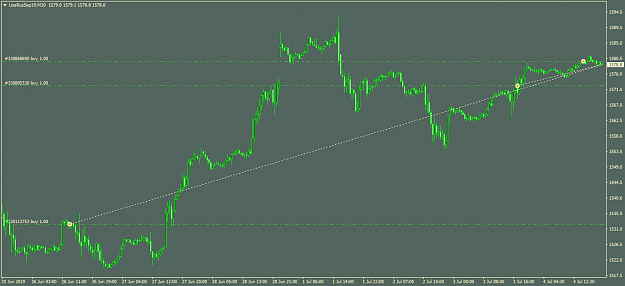
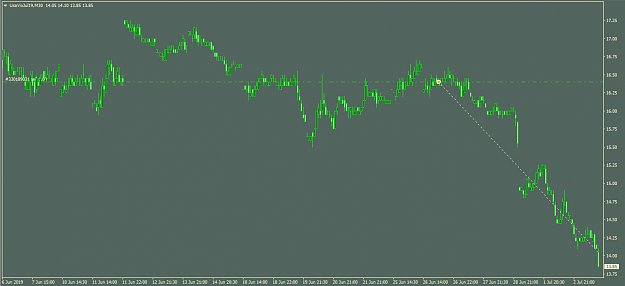
I tried to add an estimation of the trend too (I'm not claiming I succeeded here!). Originally I wanted to see if these "volatility cones" can help recognizing quickly a bad day. Look what happens when the price escapes the cone in term of retracement. Problem: At the early stage of the cycle the cone is so small that the price always leaves it. (adding an offset?) {image}
Ignored
Where can I get information on how to calculate the volatility cone? Thanks
Joined Aug 2015
|
Status: Coding Magician
|2,675 Posts
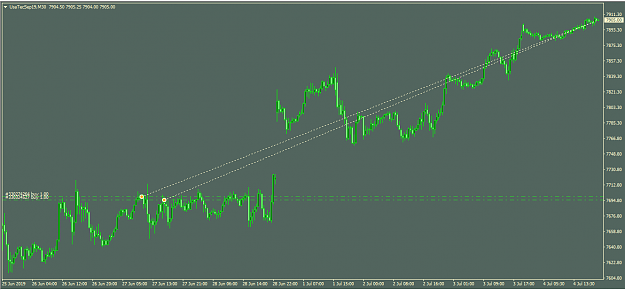
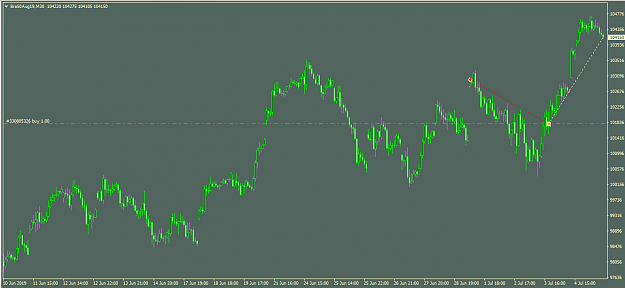
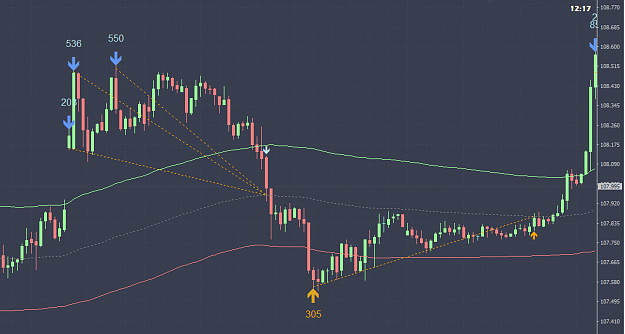
Nice idea but why not use instead of complicated drawings simple a ma and trade to the ma when you have a large deviation from it....
Simply an ema 150 with distance 2 * (high-low) of emas...cause i m a lazy coder....
Nice idea but why not use instead of complicated drawings simple a ma and trade to the ma when you have a large deviation from it.... Simply an ema 150 with distance 2 * (high-low) of emas...cause i m a lazy coder.... {image}
Ignored
Hi, could you please share this EA? I've also been experimenting with distance to (E)MA's and this seems like a reliable system.
Thanks in advance
{quote}
2. I found it very important to form an appreciation of the average trading session ranges for the symbol of interest; 3. How far price moves on average in a relevant part of the trading session (Use Excel or an indicator to record this data !)
Ignored
I'm looking for indicator.
Could you tell me how to download?