Hi, I'm going to be sharing my trade signals. I am starting 5/3/2020 with $5,000 equity. I will be targeting 40% utilization of equity as a re balancing point.
I find that trading charts introduces too much subjectivity for my temperament. This uses charting concepts and math, but allows me to easily trade the system from a dashboard without needing to look at charts.
It is a once daily re balance system. All the calculations are done in excel. It uses a fixed data connection via Thompson to download my price data at the close everyday. I will share my signals and thoughts on implementing this strategy in some level of transparency because I am also open to learning other's ideas related to this system.
A little about me: I don't trade my account for a living but I've work in the investment profession my entire career, I like to tinker with some of my cash in systems that I think up, test, and systematize. I don't know computer programming languages (yes, I'm sure things could be more efficient) but I am pretty dope in Excel.
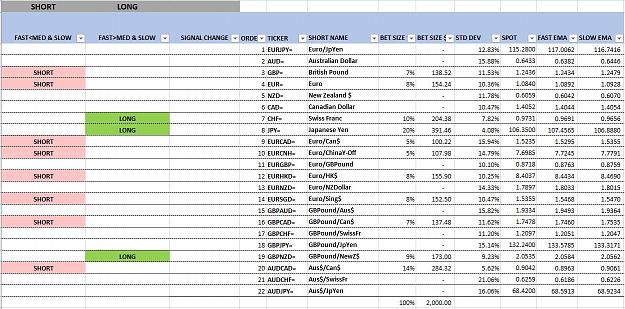
The system controls & normalizes for risk by adjusting the bet size so less volatile pairs receive larger bets and more volatile pairs receive smaller bets. This is a formula from a well publicized and back tested white-paper on price momentum trend following systems, author works at AQR. This was the inspiration for this system build out. https://www.aqr.com/Insights/Researc...eries-Momentum I use this same logic to run a Option Theta Selling system strategy I wrote too.
This is what happens:
Daily my system automatically pulls down price data for 22 currency pairs.
These are run thru a ~1yr backtest on each 22 currency pairs using a EMA cross-over strategy. I have tested this to be profitable over multiple time periods and currencies.
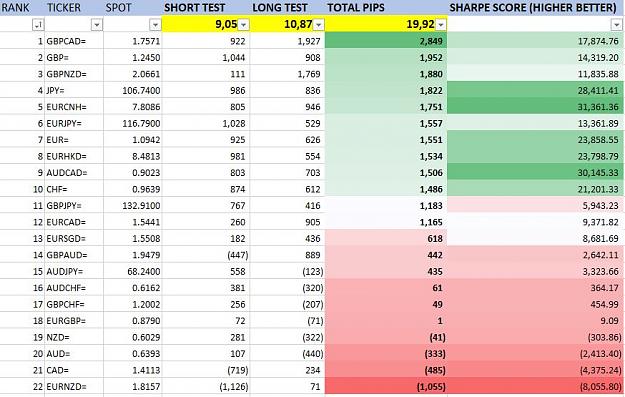
This step is important, an extra precaution, a trading signal will only be generated if the currency pair has generated >1000 pips in the past 1yr rolling-period. This system seems to do the best in chop. It actually under performs in strong-trending markets on the back-tests I looked at. This really surprised me as it wasn't my intent to bias the trading signal direction in one way or another. It seems that trading systems trend on different pairs just like price does. i.e. Growth > Value in the equity market.
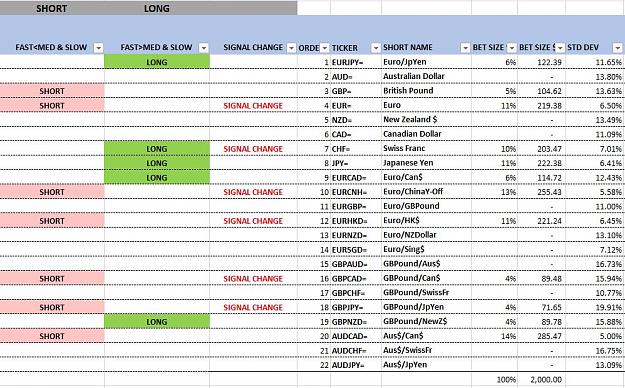
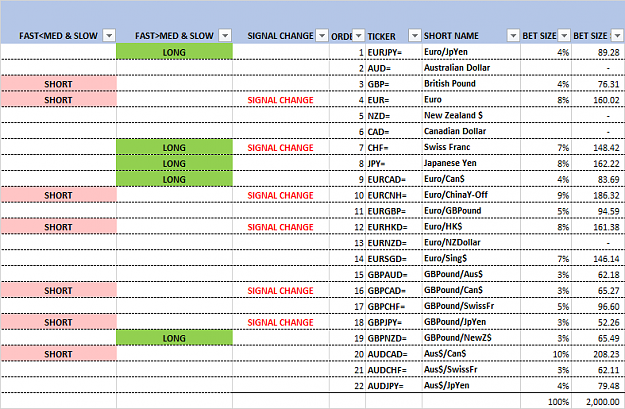
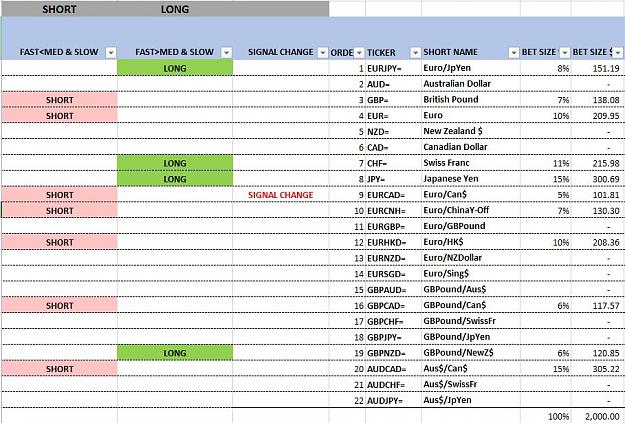
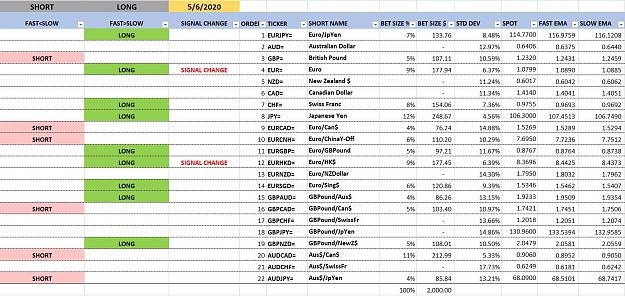
The dashboard reports the SHORT or BUY signal, and lets you know if the signal changed the PRIOR day. That way you know what you need to trade that day.
The bet size is scaled to my 40% target % of equity (starting with $5,000). As mentioned, it then normalizes to make each pair's ex-ante volatility estimate equal.
A look at the back-test data. The file is 18mb. It's pretty, isn't it?
This is where the unprofitable pairs running my system get filtered out if <1000 pips generated on the backtest.
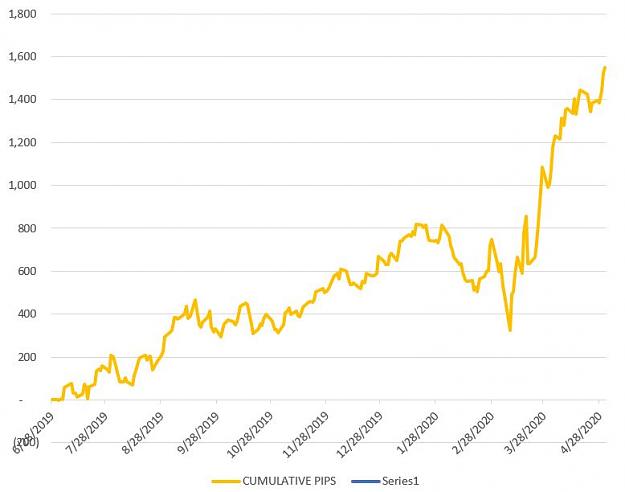
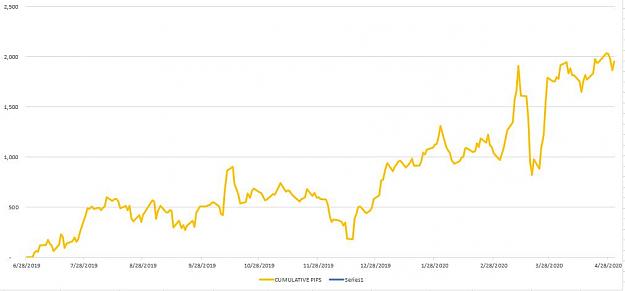
This is the trailing cumulative pip back test from the EUR pair and GBP.
