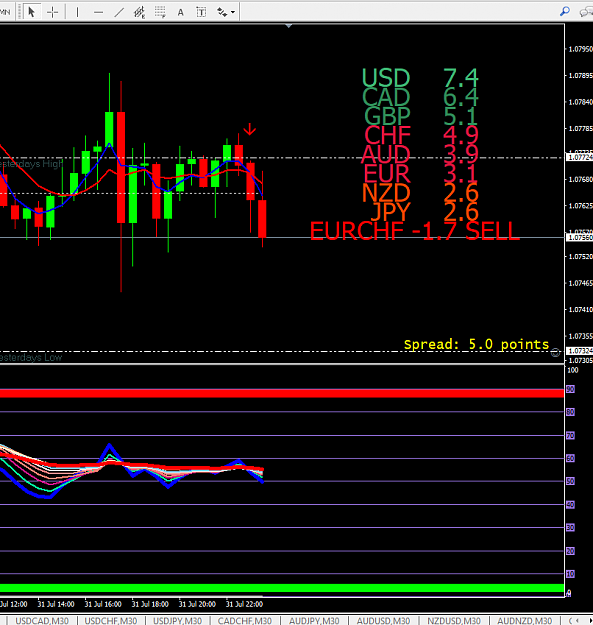
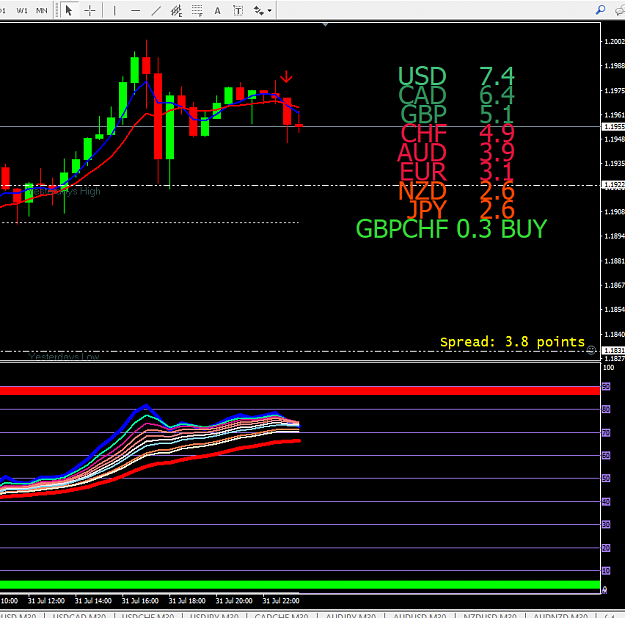
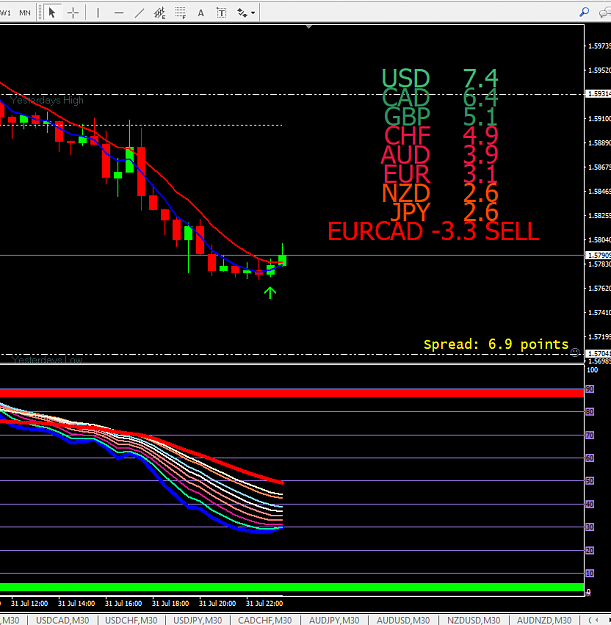
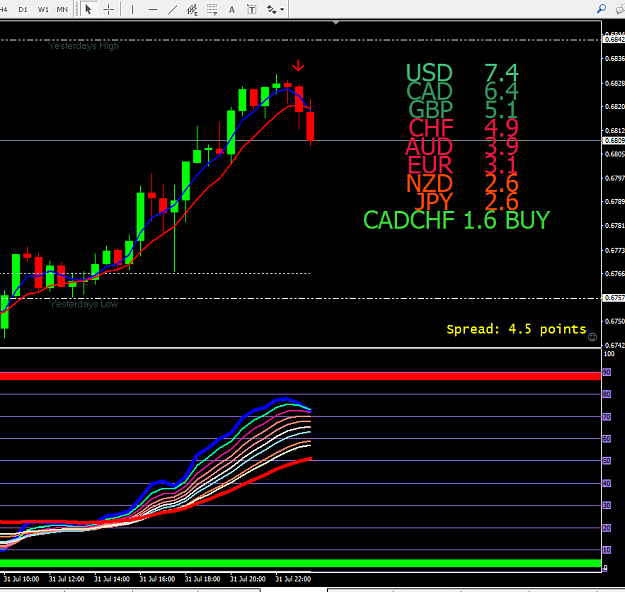
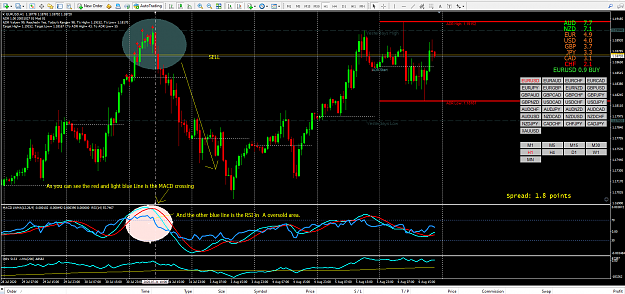
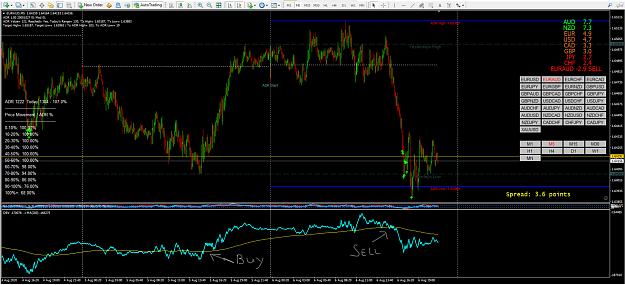
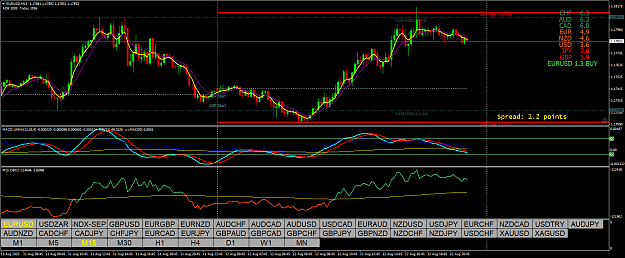
I suppose the first thing is to recognise where to enter the trade,
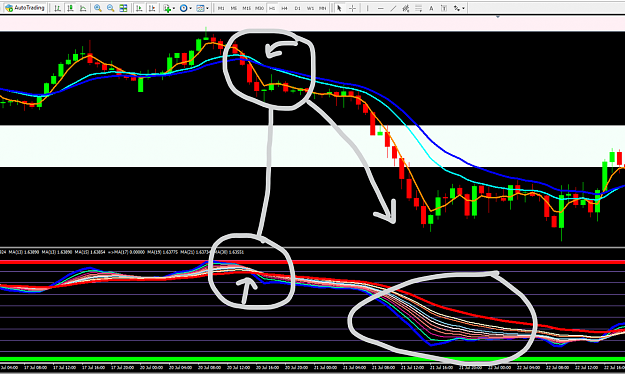
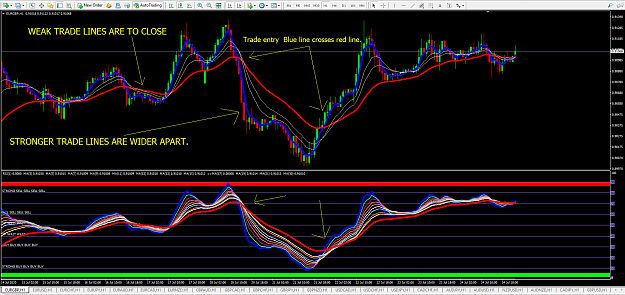
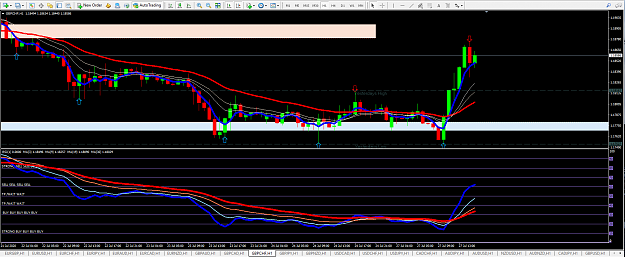
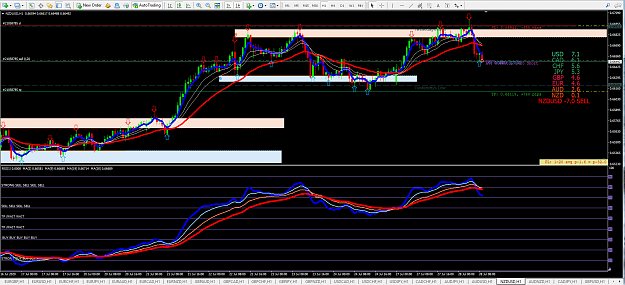
On the main chart, The blue and the green line when they cross confirmed with the red and the blue line on the bottom chart looks like the main indication to enter the trade,
Also, it has to be in the overSold and bought part of the RSI,
So that looks like between 90 and 70 for a Sell, And 10 and 30 for a buy, Looks like a pretty simple System,
It looks like the more the lines separate the stronger the trend
my first question would be, moving averages are they really that good we know they don't repaint, But they do lag behind,
well, I will give it a test,
