{quote} See Post 17 about the ZigZag, we are testing a switch to another ZigZag indicator as the Swing ZZ code is not working under all circumstances.
Ignored
Thank you for your help.
Do you think its better to use a ZigZag with Min. leg height adjustable from indicator settings?
like if we set on 350 points, it will just draw legs/swings bigger than 350 points height.
{quote} Thank you for your help. Do you think its better to use a ZigZag with Min. leg height adjustable from indicator settings? like if we set on 350 points, it will just draw legs/swings bigger than 350 points height.
Ignored
ok, the market decides where the ZZ's print, removing ZZ's is not handy because you also want to see if the market goes into a small range (when the ZZ's have a shorter distance to each other. You can set the ZZ-3 to ZZ-4 if you want, but you would get less ZZ's.
So we dont use the ZZ for distance measure, before we open a trade we measure the distance to the upper support line for a short.
Depending on the timeframe, it should have a minimum distance.
{quote} ok, the market decides where the ZZ's print, removing ZZ's is not handy because you also want to see if the market goes into a small range (when the ZZ's have a shorter distance to each other. You can set the ZZ-3 to ZZ-4 if you want, but you would get less ZZ's. So we dont use the ZZ for distance measure, before we open a trade we measure the distance to the upper support line for a short. Depending on the timeframe, it should have a minimum distance.
Ignored
yes you are totally right.
What I want to say is using ATR ZigZag to have statistically approved legs. what this mean?
for each time-frame we have ATR value. for example for EURUSD and H1 ATR is around 150 points. Using this data we can filter range from trend considering that if legs are less than like 66% of Time ATR (in this case 150 points * 0.66 = 100 points) then it can be a Range.
If legs are above 2.5 * ATR (in this case 150 * 2.5 = 375 points) it is absolutely a trend in that time-frame.
between these two numbers market is in a transition form. This means attaching two zigzag to a chart.
I think leg height based ZigZag can make our vision more mathematically.
{quote} Bubalus, didn’t I read somewhere that the psar switch needed to happen within 3 bars after the yellow dot?
Ignored
Yes, in general, the closer the psar switch to the ZZ, the better it is.
In this case, the candles are already 5 days in a range. yesterday and today are a long and the osma is on the right side, giving enough conformation for a valid psar.
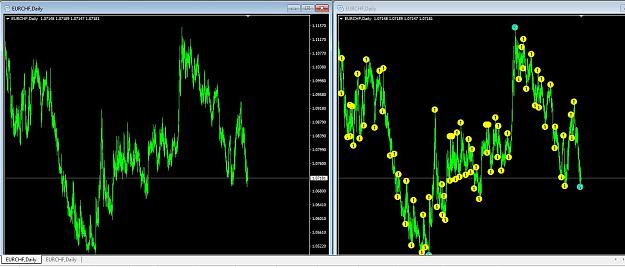
As the Swing_ZZ sometimes dissapears from the chart, (like on the EURCHF Daily on the left chart) the standard ZZ was adapted to emulate the Swing_ZZ, result on the right chart.
I just join Discord, and there is a section in which the trading signal is issued by the bot.
============
PSAR is at TOP D1Candle(1) direction is SHORT
M5 Candle(1) direction is SHORT
ZZ13(M5) at Top. 70 bars ago. ZZ-Value=0.84841 Price:0.84823
ZZ3(M5) at Top. 2 bars ago. ZZ-Value=0.84815 Price:0.84794 Optional Checks:
OSMA D1 is below
OSMA (0)M5 is above
M5 SupDem check: price is in right corner from 0.84825 to 0.84793 Broker time: 04:50:08 UTC Time: 15.10.2021 01:50:12
============
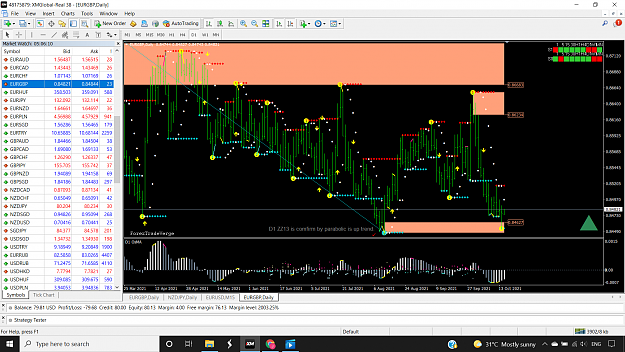
Below is the image showing in D1 in my terminal.
I think it is supposed to be "Up Trend" in D1 chart. But the Signal is saying D1 Candle is "Short".
Is it a bug on the Signal? Or have I interpreted it wrongly? Anyone kindly help correct me am I wrong on the D1 Signal?
I just join Discord, and there is a section in which the trading signal is issued by the bot. ============ PSAR is at TOP D1Candle(1) direction is SHORT M5 Candle(1) direction is SHORT ZZ13(M5) at Top. 70 bars ago. ZZ-Value=0.84841 Price:0.84823 ZZ3(M5) at Top. 2 bars ago. ZZ-Value=0.84815 Price:0.84794 Optional Checks: OSMA D1 is below OSMA (0)M5 is above M5 SupDem check: price is in right corner from 0.84825 to 0.84793 Broker time: 04:50:08 UTC Time: 15.10.2021 01:50:12 ============ Below is the image showing in D1 in my terminal. I think it is...
Ignored
In the right top of the chart you see S1 (yesterday candle 1) and S0 (todays daily candle color), the spotter uses 1 till approx 8 am london and then switches to 0
You want to temove the osma indicator and place it back again to clear all these springing colors from the osma oscillator
{quote} In the right top of the chart you see S1 (yesterday candle 1) and S0 (todays daily candle color), the spotter uses 1 till approx 8 am london and then switches to 0 You want to temove the osma indicator and place it back again to clear all these springing colors from the osma oscillator
Ignored
Thanks Babalus for the answer.
Can you kindly elaborate what is the usage and the meaning of the Right Top Indicator on our chart as you mention? I really no idea what is it all about and what is it for.
{quote} Thanks Babalus for the answer. Can you kindly elaborate what is the usage and the meaning of the Right Top Indicator on our chart as you mention? I really no idea what is it all about and what is it for. Thanks you.
Ignored
above the row you see the timeframes, so if on s1 row on tf D1 the color is red, yesterdays daily candle was a short
{quote} If it is yesterday color red, which means it short. May I know how to use this indicator with this strategy? Do you mean that yesterday D1 must same as today D1 which is RED, then only can go for "Short"?
Ignored
Simple Follow the Rules : From page 1
4. Timeframes: H4 and M30 Direction: Trade in the direction of todays D1 candle.
{quote} Simple Follow the Rules : From page 1 4. Timeframes: H4 and M30 Direction: Trade in the direction of todays D1 candle.
Ignored
Sorry for the dumb question, regarding the rules No 4.
1. Timeframe, do it means by scanning valid entry Signal on H4, then switch to M30 to enter trade on good position?
2. About "Trade in the direction of today D1 candle", what do it actually means?
Do it means by waiting today candle to form bullish, then only can go Buy?
Or waiting today candle to form bearish then only permit to go Sell?
{quote} Sorry for the dumb question, regarding the rules No 4. 1. Timeframe, do it means by scanning valid entry Signal on H4, then switch to M30 to enter trade on good position? 2. About "Trade in the direction of today D1 candle", what do it actually means? Do it means by waiting today candle to form bullish, then only can go Buy? Or waiting today candle to form bearish then only permit to go Sell? Regards.
Ignored
Timeframe, do it means by scanning valid entry Signal on H4, then switch to M30 to enter trade on good position? No drop to M15 or lower.
Do it means by waiting today candle to form bullish, then only can go Buy? Yes
Or waiting today candle to form bearish then only permit to go Sell? Yes
{quote} Timeframe, do it means by scanning valid entry Signal on H4, then switch to M30 to enter trade on good position? No drop to M15 or lower. Do it means by waiting today candle to form bullish, then only can go Buy? Yes Or waiting today candle to form bearish then only permit to go Sell? Yes
Ignored
Maybe I get what you mean now.
1. We can either choose H4 OR M30 to find valid signal from the rules set.
Then, drop down to either M15 OR M5 to enter any trade ya?
2. By means on trade in the direction of today candle means is....
We need to compare today and yesterday candle, if today is bearish candle form, check back yesterday candle must be also same as bearish, then only can go SHORT Sell ya?
3. If that is the case, if we need to wait today candle to form bearish or bullish candle, how to estimate it is bearish candle or bullish candle?
Is there any way of confirmation of it is consider bearish or bullish candle for that particular D1 candle?
4. In some case, D1 candle can be form after certain pips amount then it could make it's way back from bearish to bullish, or from bullish to bearish.
Those candle form bearish OR bullish is on uncertainties.
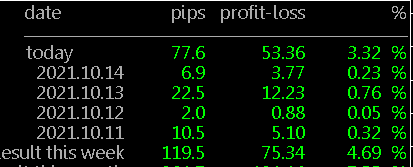
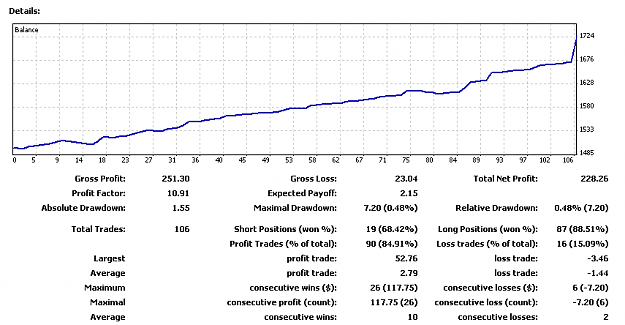
this is over 4 weeks, of interest is the max draw down, long and short positions won are not good because i close trades in loss at the end of the day, no open orders atm