Disliked{quote} I have been looking at how you use the fibos to set targets. As I mentioned previously it looks very similar to how walvekarraje does it. Could you give me an idea of what your typical target size in pips is on H4?Ignored
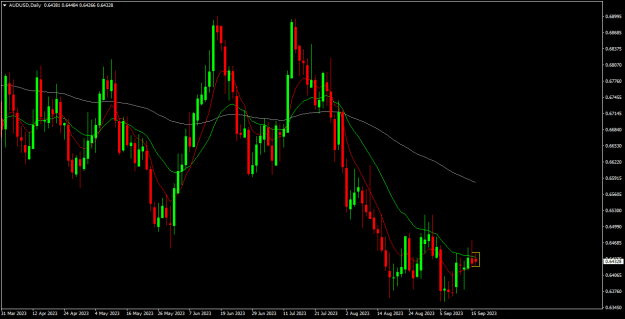
Method 1 - Measuring the Impulse Wave
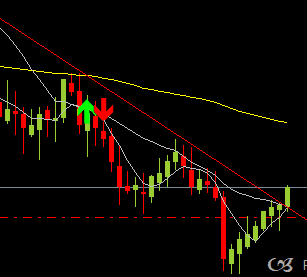
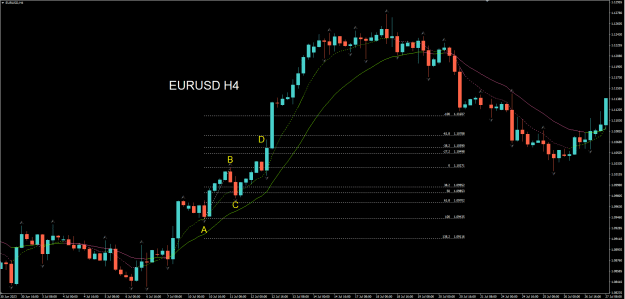
The standard way would be to draw the fib from the start of the impulse wave at point A at 100% to point B at 0%. Point C would be your retracement. This retracement could coincide with whatever confluence of your liking. S/R, Imbalance, Divergence, Trendline Bounce, Trendline Break. The extra sauce is up to you.
Projected targets (measuring from the 50% retracement)
- -27.2% - 62 pips
- -38.2% - 72 pips
- -61.8% - 94 pips
- -100% - 125 pips (aka full extension)
Attached Image (click to enlarge)
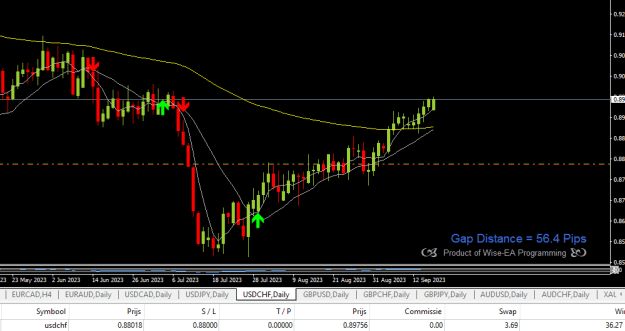
Method 2 - Measuring the Retracement
This is a more conservative TP approach. Instead of measuring the impulse wave, you measure the correction wave from B at 0% to C at 100% and use fib extensions as targets.
I normally target these 2 fib extensions. Assume we enter at 50% at point C.
- 138.2% - 60 pips
- 161.8% - 72 pips
Attached Image (click to enlarge)
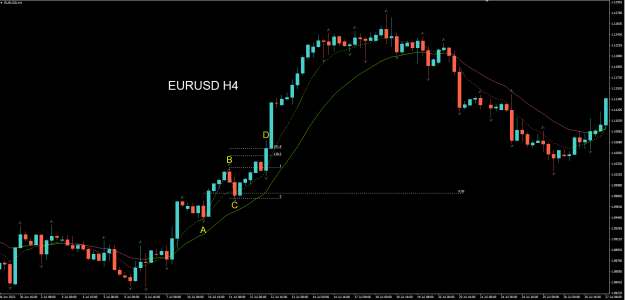
These are more conservative targets and you're working under the assumption that point C will hold as a swing point. More interestingly, you will see price tend to stall at 138.2% and 161.8%. Of course, that's not always the case, but if you draw these fibs, you'll notice price will very often go to these levels to the pip. On multiple time-frames. There's nothing magical about this. I think they are just very common projection targets.
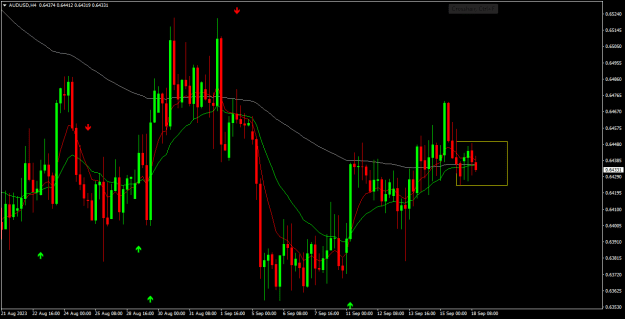
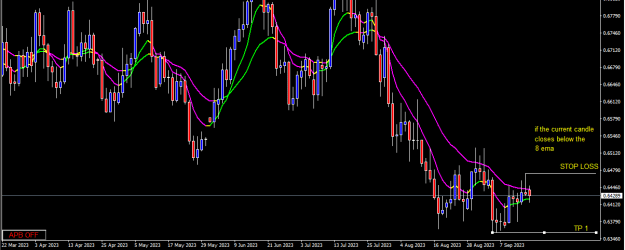
There's nothing fancy about using fibs. They're really just a simple percentages to measure retracements and projections. The underlying concepts are your basic 123 and ABCD patterns. Nothing ground breaking. 8/20 ema serves as a trend filter. You use fibs to set entries, stoplosses and targets.
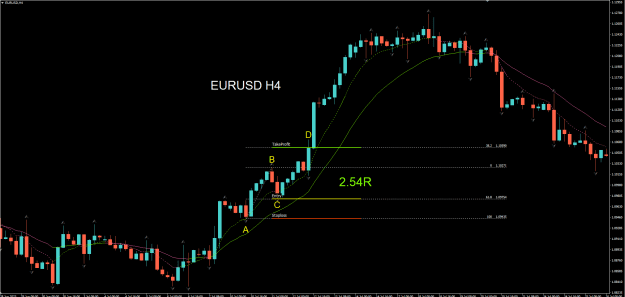
A simple positive R:R system
- Price is trending as shown by 8/20 ema cross over.
- Measure a strong impulse wave.
- Set limit order at 61.8%
- SL at 100%
- TP at -38.2%
- This will always result in a more than 1:2 RR as long as you trade bigger timeframe
Attached Image (click to enlarge)
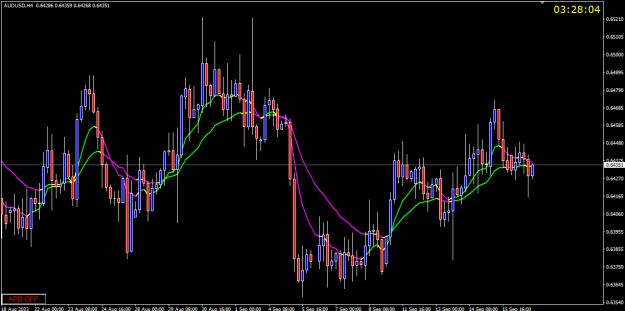
You can improve on this with candlestick patterns, confluences, etc. The problem here is that strong trends don't tend to retrace to 61.8%. They tend to be shallower at the 38.2%, sometimes not even. And you would need to target further fib extensions in order to yield a positive R:R.
But the concept is simple. Trends and pullbacks.
Leave the Gun, Take the Armani
1