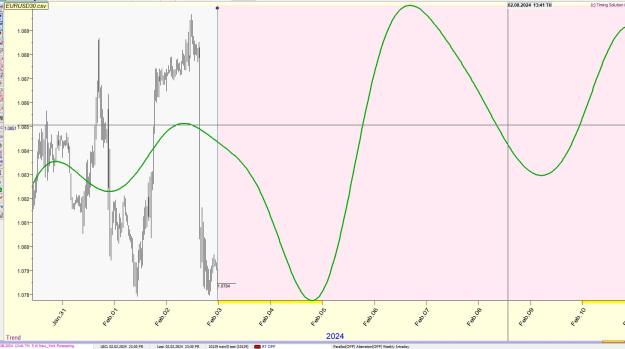
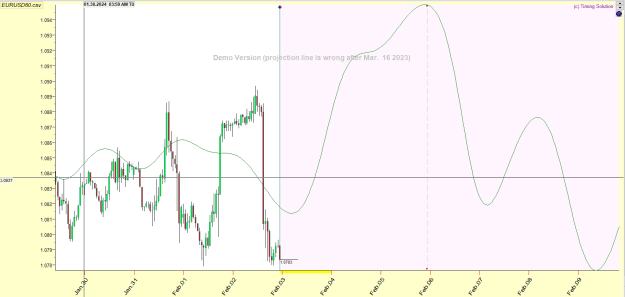
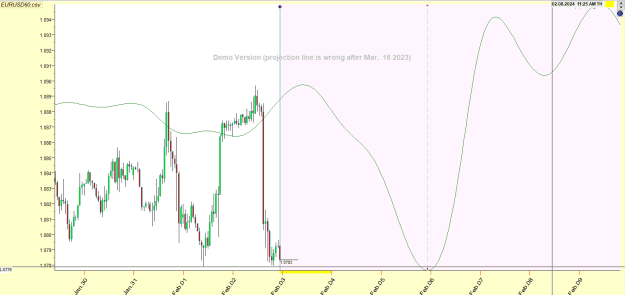
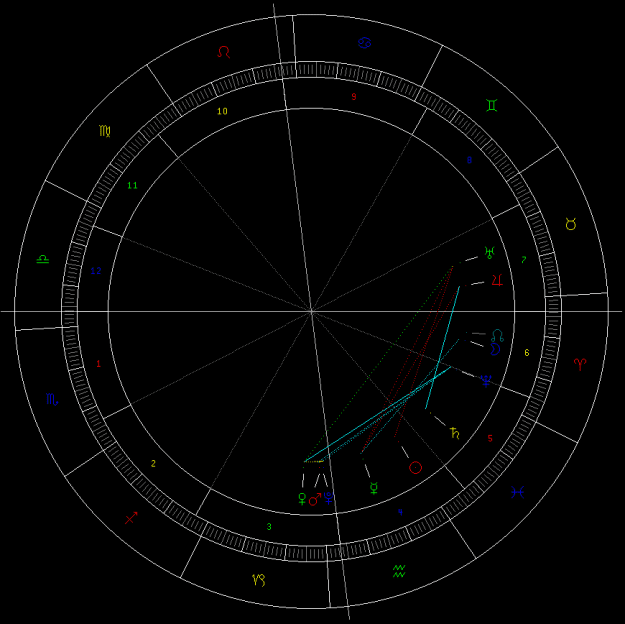
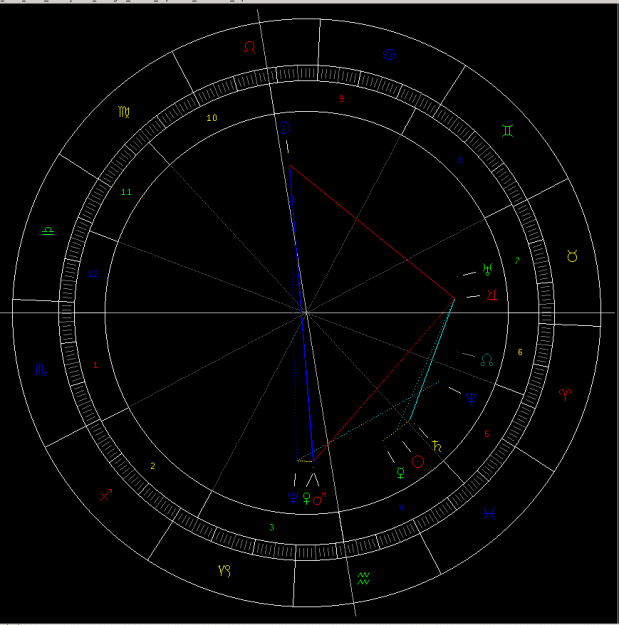
This week we have Mercury-Pluto conjunction, it's strongest on Feb 5th around 8am EST where the two planets will be at 300º. Jerry, could you please plot it properly when you have a chance. I have normal and inverted
{quote} Nice and easy. I will keep Buy stop order as main tool for trading until February 8, 2024 and Sell Stop from mid day of Feb 8 to Feb 9. I will try my best to post daily the starting point of pending order as per plan at Asian open time.
Ignored
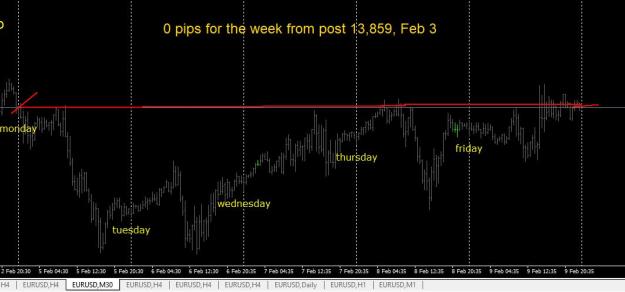
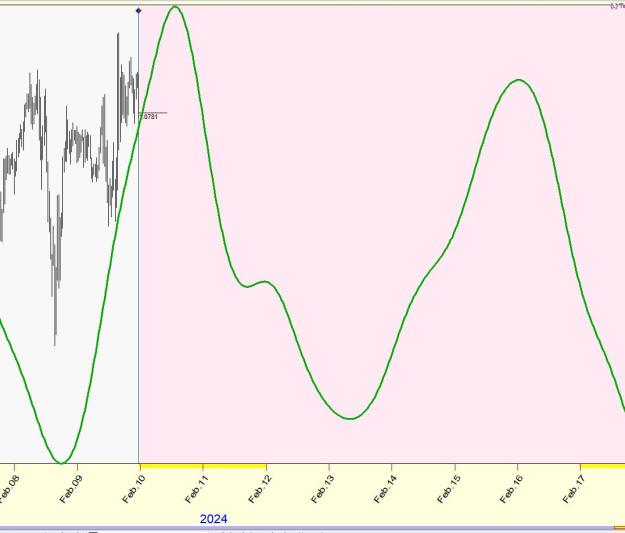
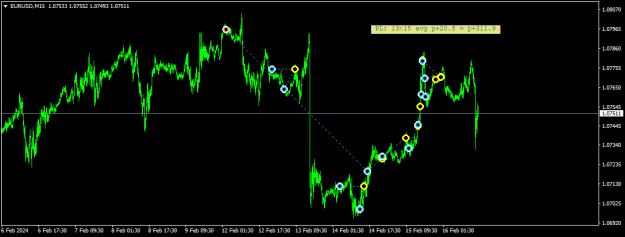
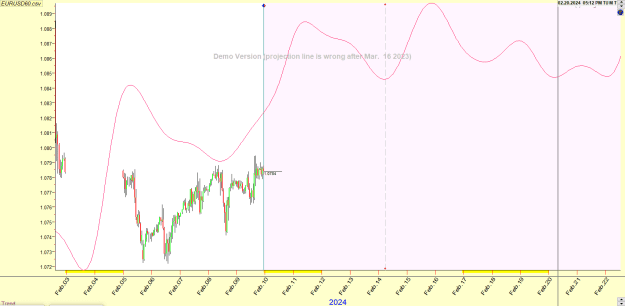
Buy stop 1.0791 for up slope as per jnevins projection line for final target 1.0832 or NY session close
Hello all, This week we have Mercury-Pluto conjunction, it's strongest on Feb 5th around 8am EST where the two planets will be at 300º. Jerry, could you please plot it properly when you have a chance. I have normal and inverted Thank you! {image} {image} {image}
Ignored
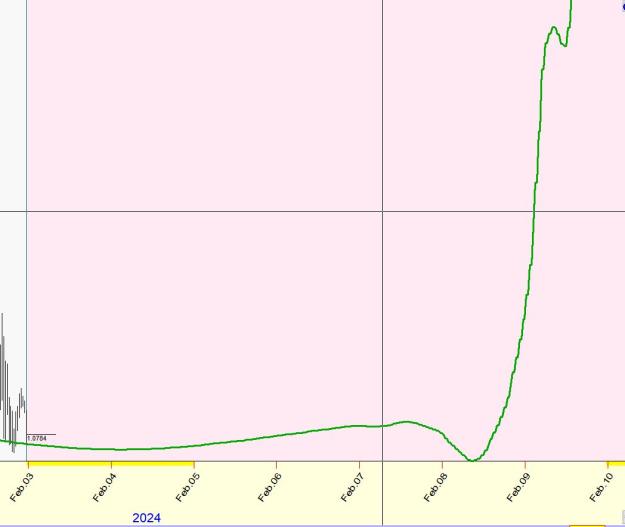
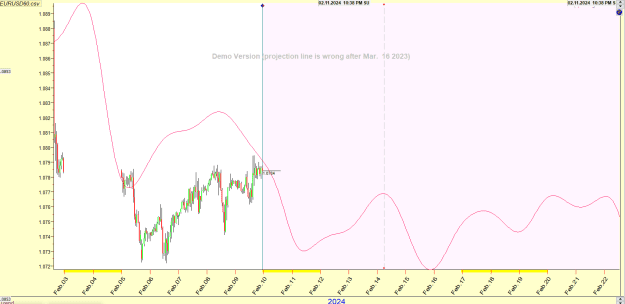
Here is Mercury-Pluto 12 harmonic, smoothed 500% That harmonic was closest to a 30 day peak on a spectrum study. Not confident this is accurate. The 1st harmonic gave a curve that was not accurate, as if there was a math problem with the calculation. (fig 2.) that is a 1st harmonic 100% smooth orb, normal curve.
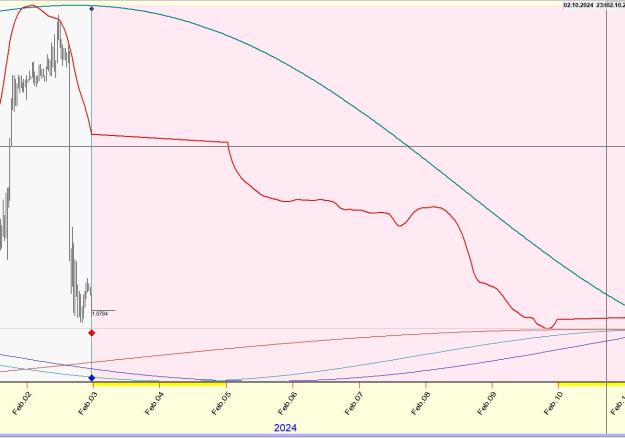
I ran the self similarity module again and provide a new curve here as an update... The blue green line is a spectrum study using longer cycle lengths.
I ran the self similarity module again and provide a new curve here as an update... The blue green line is a spectrum study using longer cycle lengths. {image} {image}
Ignored
Today Buy stop did not triggered so there is no trade as per projection line.
Thanks jnevins for updating the projection line. Now i will stay with Sell Stop because slope of projection line is downward.
{quote} What version of TS do you have? What is its release date?
Ignored
now it is ok...I can plot planetary lines in real time
question:
I want scale my chart with same input I use for my mt4 platform
example with fake input: 16 bars and 30 pips
I see that in TS there are input for bars and $...how do I do for pips? I write 16 in window Time and 0.0030 in window $ and then click ok but nothing happens
thank you another time for your help
{quote} now it is ok...I can plot planetary lines in real time question: I want scale my chart with same input I use for my mt4 platform example with fake input: 16 bars and 30 pips I see that in TS there are input for bars and $...how do I do for pips? I write 16 in window Time and 0.0030 in window $ and then click ok but nothing happens thank you another time for your help
Ignored
Sorry, I don't know the answer to this question....
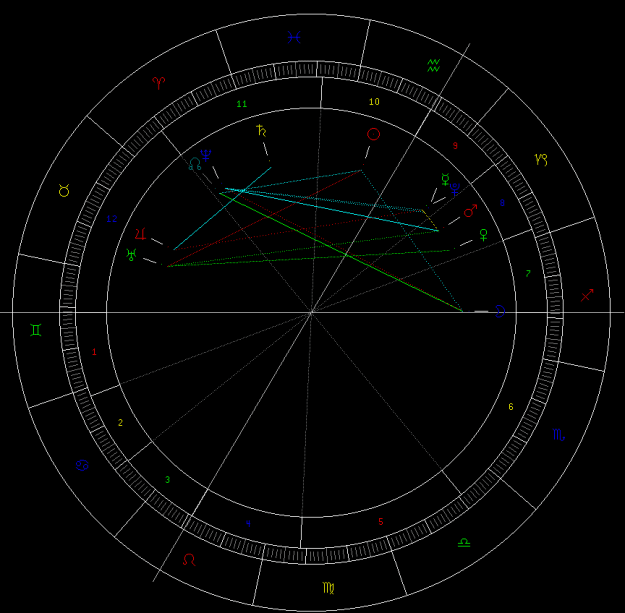
Hello guys, this week we have Mars-Pluto conjunction at 300°. I plotted with demo TS normal and inverted. Jerry, could you please plot on Astronomy module when you have a chance. Thank you!
Hello guys, this week we have Mars-Pluto conjunction at 300°. I plotted with demo TS normal and inverted. Jerry, could you please plot on Astronomy module when you have a chance. Thank you! {image} {image} {image}
Ignored
Hi Ultras,
This aspect using a 1h setting looks like this. As a first, here is a screen shot across 2 monitors.
That cycle is very long though at 600+ days.
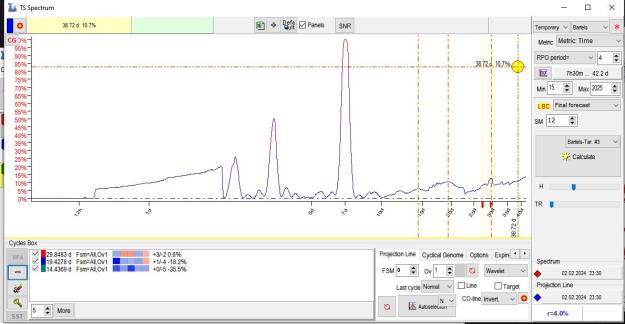
Here is a 13.3 day pcycle, taken from a prominent peak on the spectrum cycle , smoothed to 500% , image 2
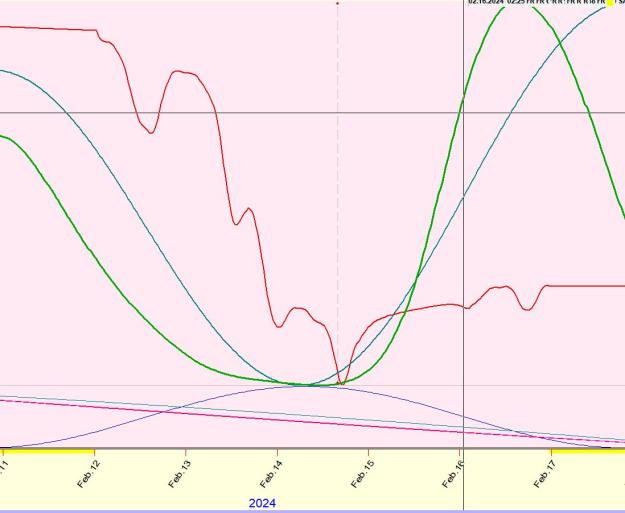
Outlook for next week... Green line= Mars and Venus are conjunct as the week begins.. a powerful EURUSD signature. Red Line= Similarity study using 3 day custom period in Auto-C and smooted to 10 Teal Line= Bartels-Tarasov study from Spectrum module and inverted. {image}
{quote} Which post you prefer , post 13,873 or 13,869?
Ignored
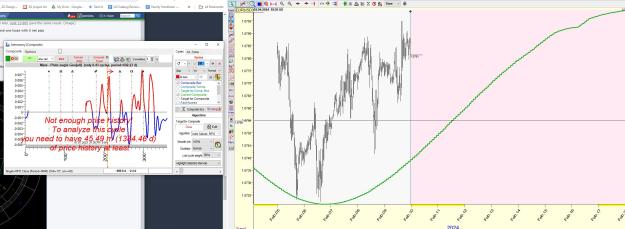
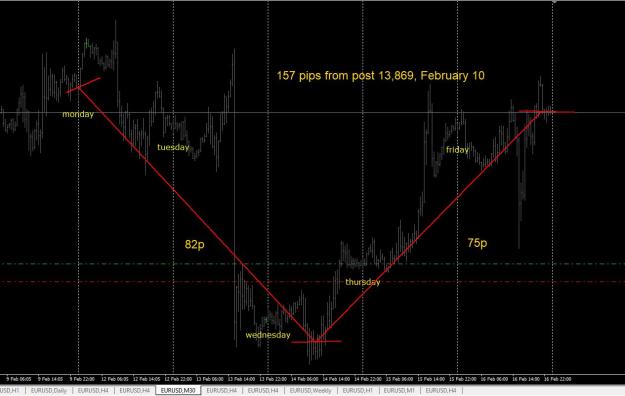
Both begin the week with a nice swing down (that happened and accelerated with the inflation news this morning)... it is a matter of when to go long, now or wait a bit more... The right thing to do in this case is to draw a trendline and wait for the breakout...
{quote} Both begin the week with a nice swing down (that happened and accelerated with the inflation news this morning)... it is a matter of when to go long, now or wait a bit more... The right thing to do in this case is to draw a trendline and wait for the breakout...
Ignored
Amother way to look at the situation is that both curves are correct... enter long at either one.
{quote} Amother way to look at the situation is that both curves are correct... enter long at either one.
Ignored
By observing your projection line, i did some scalping by adding some of my trading experience(Volume analysis). Here are results on live account so far
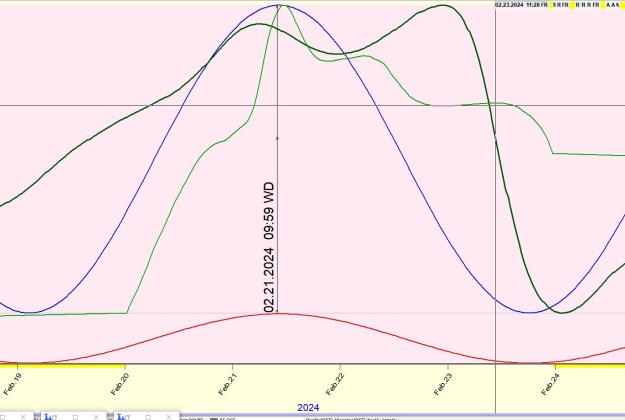
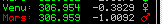
Outlook for next week: Venus and Mars form a prominent conjunction this week... the dark green line is derived from that aspect. The blue line is a spectrum study line and the light green line is an Auto-C self similarity study.
Hi Jerry, yes this is great, we have Mars-Venus conjunction and it's going to be strongest on Friday the 22nd at 306°, when we should hit the top of your projection line