Alphabet Inc. ($GOOGL) Found Buyers at the Blue Box Area as Expected.
March 11, 2024 By EWFTaha
Hello everyone. In today’s article, we will look at the past performance of the 4H Hour Elliott Wave chart of Alphabet Inc. ($GOOGL). The rally from 10.27.2023 low at $120.25 unfolded as 5 waves impulse. So, we expected the pullback to unfold in 3 swings and find buyers again. We will explain the structure & forecast below:
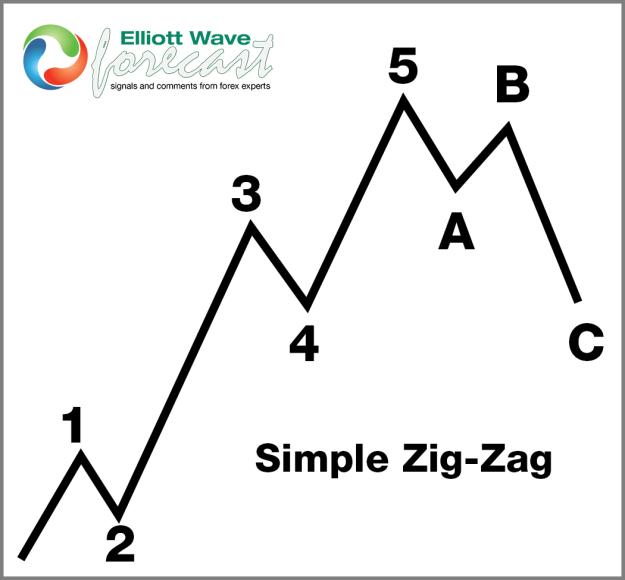
5 Wave Impulse Structure + ABC correction
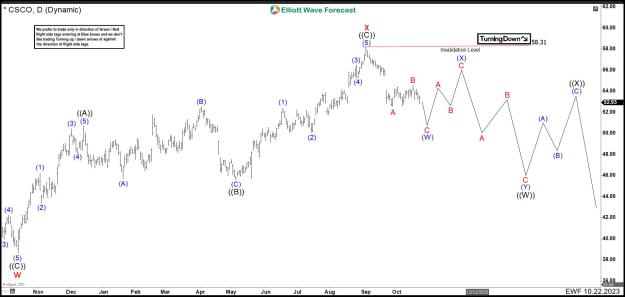
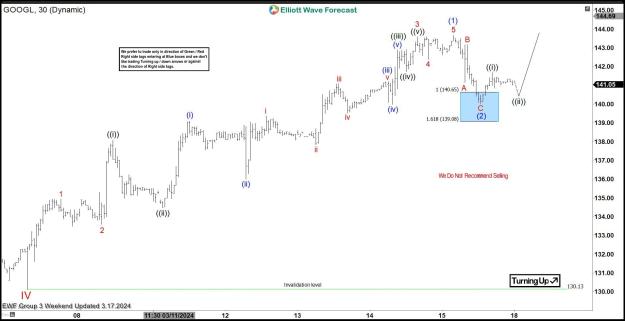
$GOOGL 4H Elliott Wave Chart 2.29.2024:
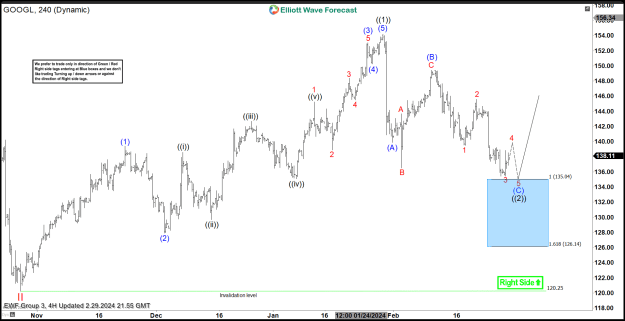
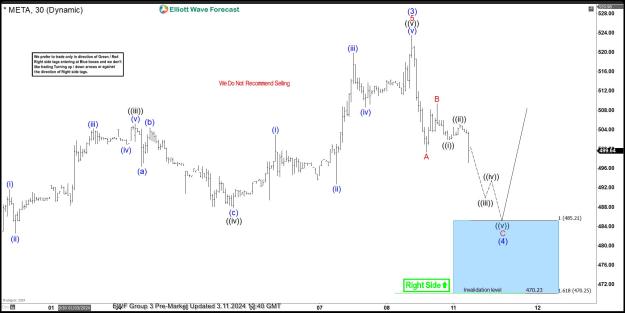
Here is the 4H Elliott Wave count from 2.29.2024. We expected the pullback to find buyers at the blue box area at 135.04 – 126.14 in 3 swings.
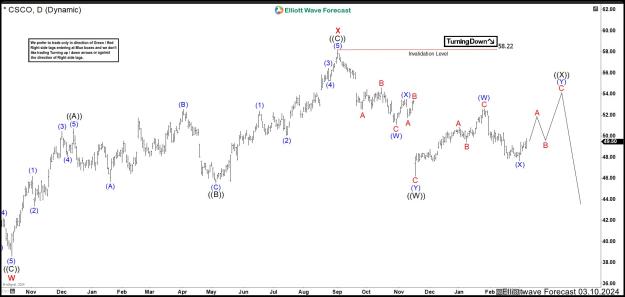
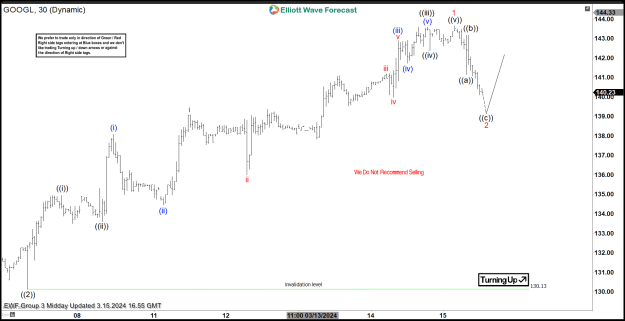
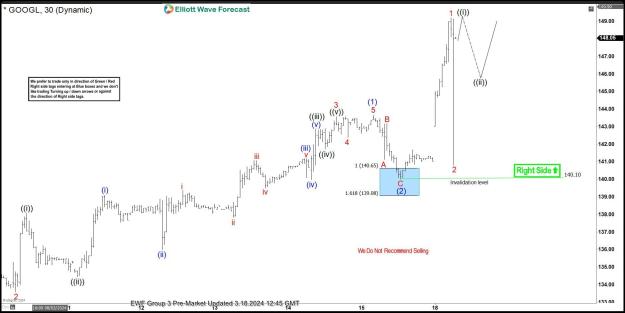
$GOOGL 4H Elliott Wave Chart 3.11.2024:
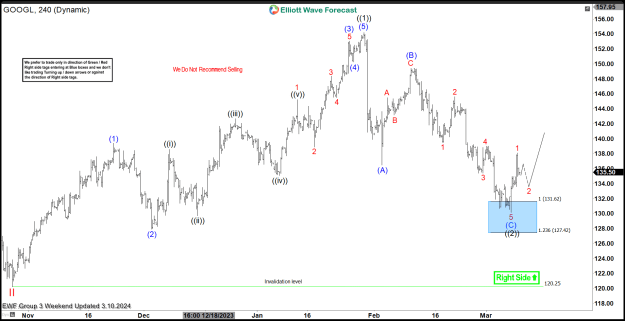
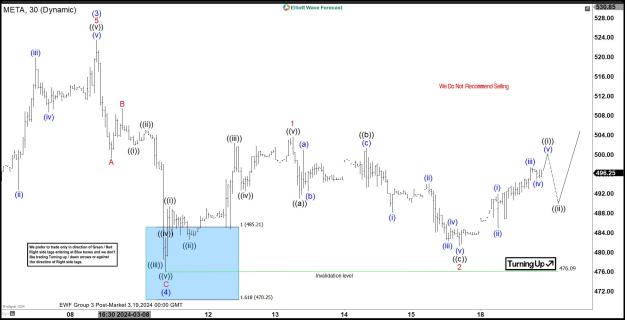
Here is the latest 4H update from 3.10.2024 showing the bounce taking place as expected. The stock has reacted higher from the blue box area ending the 3 swings decline. The stock is expected to remain supported towards $142 – 145 where longs will be able to get risk free. A break above 1.29.2024 peak at 153.78 will open the next leg higher towards $164 – 185.
Elliott Wave Forecast
We cover 78 instruments, but not every chart is a trading recommendation. We present Official Trading Recommendations in the Live Trading Room. If not a member yet, Sign Up for Free 14 days Trial now and get access to new trading opportunities.
Welcome to Elliott Wave Forecast!
Source:https://elliottwave-forecast.com/sto...area-expected/
March 11, 2024 By EWFTaha
Hello everyone. In today’s article, we will look at the past performance of the 4H Hour Elliott Wave chart of Alphabet Inc. ($GOOGL). The rally from 10.27.2023 low at $120.25 unfolded as 5 waves impulse. So, we expected the pullback to unfold in 3 swings and find buyers again. We will explain the structure & forecast below:
5 Wave Impulse Structure + ABC correction
Attached Image (click to enlarge)
$GOOGL 4H Elliott Wave Chart 2.29.2024:
Attached Image (click to enlarge)
$GOOGL 4H Elliott Wave Chart 3.11.2024:
Attached Image (click to enlarge)
Elliott Wave Forecast
We cover 78 instruments, but not every chart is a trading recommendation. We present Official Trading Recommendations in the Live Trading Room. If not a member yet, Sign Up for Free 14 days Trial now and get access to new trading opportunities.
Welcome to Elliott Wave Forecast!
Source:https://elliottwave-forecast.com/sto...area-expected/