zmm20ChartArt 2 months ago @ChartArt, Yep. All this strategy does is buy if the close price is higher than the open price, and sell if the close price is lower than the open price. Because of the way Tradingview implements custom timeframes, all the strategy is doing is comparing open/close values that are known at the BEGINNING of the interval, so the results are completely worthless. I wrote my own strategy just like this that gets even better results, it's only 4 lines long lol.
Did you read that post?
is about your first strategy.
I see the above poster never got an answer. I have the same thing and need someone to convert trading view script to MT4.
Ignored
Perhaps he never got an answer because the coders have no idea what is required , it might be an idea to post the trading view script or at least a screenshot or description so coders have some idea what you want????? Its up to the requester to provide the information and then the coder to code based on that information. If no information is supplied no code is done, it's really as simple as that.
{quote} {quote} Perhaps he never got an answer because the coders have no idea what is required , it might be an idea to post the trading view script or at least a screenshot or description so coders have some idea what you want????? Its up to the requester to provide the information and then the coder to code based on that information. If no information is supplied no code is done, it's really as simple as that.
Ignored
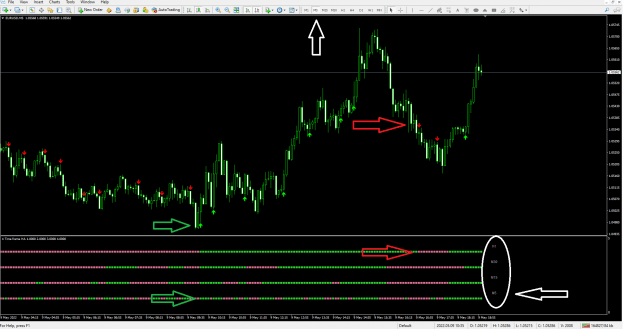
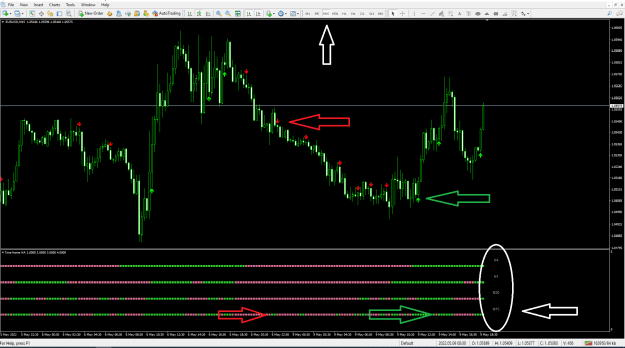
Sorry about that .What I want is to create Scalping Multi Time Frame EA of Chandelier Exit Indicator like the 2 photo below with SL & TP and specific time to turn the EA ON or OFF according to the spread of the Market the Indicator in the photo below is for Heiken Ashi if you create EA for Heiken Ashi too I will be so glad for it
{quote} {quote} Perhaps he never got an answer because the coders have no idea what is required , it might be an idea to post the trading view script or at least a screenshot or description so coders have some idea what you want????? Its up to the requester to provide the information and then the coder to code based on that information. If no information is supplied no code is done, it's really as simple as that.
{quote} {quote} Perhaps he never got an answer because the coders have no idea what is required , it might be an idea to post the trading view script or at least a screenshot or description so coders have some idea what you want????? Its up to the requester to provide the information and then the coder to code based on that information. If no information is supplied no code is done, it's really as simple as that.
Ignored
The only code I could find in Tradingview for it is as follows:
// This source code is subject to the terms of the Mozilla Public License 2.0 at https://mozilla.org/MPL/2.0/
// LonesomeThecolor.blue
//@version=4
study("Higher High Lower Low Strategy", overlay =true, max_lines_count = 500)
lb = input(5, title="Left Bars", minval = 1)
rb = input(5, title="Right Bars", minval = 1)
showsupres = input(true, title="Support/Resistance", inline = "srcol")
supcol = input(color.lime, title ="", inline = "srcol")
rescol = input(color.red, title ="", inline = "srcol")
srlinestyle = input(line.style_dotted, title = "Line Style/Width", options = [line.style_solid, line.style_dashed, line.style_dotted], inline ="style")
srlinewidth = input(3, title = "", minval = 1, maxval = 5, inline ="style")
changebarcol = input(true, title="Change Bar Color", inline = "bcol")
bcolup = input(color.blue, title ="", inline = "bcol")
bcoldn = input(color.black, title ="", inline = "bcol")
ph = pivothigh(lb, rb)
pl = pivotlow(lb, rb)
hl = iff(ph, 1, iff(pl, -1, na)) // Trend direction
zz = iff(ph, ph, iff(pl, pl, na)) // similar to zigzag but may have multiple highs/lows
zz :=iff(pl and hl == -1 and valuewhen(hl, hl, 1) == -1 and pl > valuewhen(zz, zz, 1), na, zz)
zz :=iff(ph and hl == 1 and valuewhen(hl, hl, 1) == 1 and ph < valuewhen(zz, zz, 1), na, zz)
hl := iff(hl==-1 and valuewhen(hl, hl, 1)==1 and zz > valuewhen(zz, zz, 1), na, hl)
hl := iff(hl==1 and valuewhen(hl, hl, 1)==-1 and zz < valuewhen(zz, zz, 1), na, hl)
zz := iff(na(hl), na, zz)
findprevious()=> // finds previous three points (b, c, d, e)
ehl = iff(hl==1, -1, 1)
loc1 = 0.0, loc2 = 0.0, loc3 = 0.0, loc4 = 0.0
xx = 0
for x=1 to 1000
if hl[x]==ehl and not na(zz[x])
loc1 := zz[x]
xx := x + 1
break
ehl := hl
for x=xx to 1000
if hl[x]==ehl and not na(zz[x])
loc2 := zz[x]
xx := x + 1
break
ehl := iff(hl==1, -1, 1)
for x=xx to 1000
if hl[x]==ehl and not na(zz[x])
loc3 := zz[x]
xx := x + 1
break
ehl := hl
for x=xx to 1000
if hl[x]==ehl and not na(zz[x])
loc4 := zz[x]
break
[loc1, loc2, loc3, loc4]
float a = na, float b = na, float c = na, float d = na, float e = na
if not na(hl)
[loc1, loc2, loc3, loc4] = findprevious()
a := zz
b := loc1
c := loc2
d := loc3
e := loc4
_hh = zz and (a > b and a > c and c > b and c > d)
_ll = zz and (a < b and a < c and c < b and c < d)
_hl = zz and ((a >= c and (b > c and b > d and d > c and d > e)) or (a < b and a > c and b < d))
_lh = zz and ((a <= c and (b < c and b < d and d < c and d < e)) or (a > b and a < c and b > d))
plotshape(_hl, text="HL", title="Higher Low", style=shape.labelup, color=color.lime, textcolor=color.black, location=location.belowbar, offset = -rb)
plotshape(_hh, text="HH", title="Higher High", style=shape.labeldown, color=color.lime, textcolor=color.black, location=location.abovebar, offset = -rb)
plotshape(_ll, text="LL", title="Lower Low", style=shape.labelup, color=color.red, textcolor=color.white, location=location.belowbar, offset = -rb)
plotshape(_lh, text="LH", title="Lower High", style=shape.labeldown, color=color.red, textcolor=color.white, location=location.abovebar, offset = -rb)
float res = na, float sup = na
res := iff(_lh, zz, res[1])
sup := iff(_hl, zz, sup[1])
int trend = na
trend := iff(close > res, 1, iff(close < sup, -1, nz(trend[1])))
res := iff((trend == 1 and _hh) or (trend == -1 and _lh), zz, res)
sup := iff((trend == 1 and _hl) or (trend == -1 and _ll), zz, sup)
rechange = res != res[1]
suchange = sup != sup[1]
var line resline = na
var line supline = na
if showsupres
if rechange
line.set_x2(resline, bar_index)
line.set_extend(resline, extend = extend.none)
resline := line.new(x1 = bar_index - rb, y1 = res, x2 = bar_index, y2 = res, color = rescol, extend = extend.right, style = srlinestyle, width = srlinewidth)
Hi can anyone take a look at this? Tnx // This source code is subject to the terms of the Mozilla Public License 2.0 at https://mozilla.org/MPL/2.0/ // btc_charlie / @TheParagonGrp //@version=5 indicator('[@btc_charlie] Trader XO Macro Trend Scanner', overlay=true) // Variables var ok = 0 var countBuy = 0 var countSell = 0 src = input(close, title='OHLC Type') i_fastEMA = input(12, title='Fast EMA') i_slowEMA = input(25, title='Slow EMA') i_defEMA = input(25, title='Consolidated EMA') // Allow the option to show single or...
Ignored
Take someone on fiver or mql5 if important... I m not interested because supertrend is not the strong indicator as they all say....