{quote} Sorry, I appreciate you asking, but it is personal knowledge acquired with the hard work and sweat. My point of displaying a chart is, MA Channel technique is a good starting base to work with.
Ignored
I have seen you post snap shots of your charts, that is how I figured you would answer. Kind of funny when you give RP hard time about how he posts is trades. Lol have a nice day. No further response required.
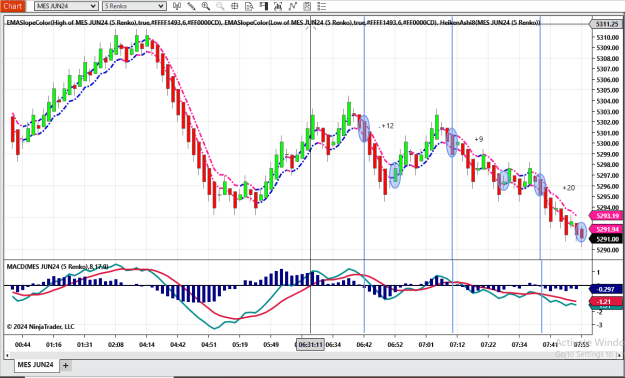
Ok think i might be done for the day. Got some other things I'm working on while I'm trading(which is why I'm trading MES today). Just ran my scans for possible option trades some some further research required. Any way 2 more trades a tiny win and a good one.
Trading 4 contracts now instead of 2. Getting to time of year when I want to get outside early so want to be done by 9am my time. Also demo trading MNQ to see how I do with it, for slow ES days.
When I was trading 2 contracts I would shoot for 100. Now with 4 contracts halved it to 50. Honestly should've done this long ago but I can be stubborn and set in my ways. Trying to lessen my time trading.
Trading 4 contracts now instead of 2. Getting to time of year when I want to get outside early so want to be done by 9am my time. Also demo trading MNQ to see how I do with it, for slow ES days.
Ignored
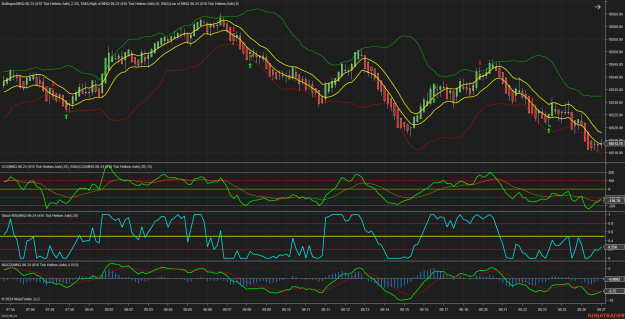
There are plenty of slow days on the ES lately. I have been trading the MNQ also. Starting to like it better. I seem to get more follow through So my trades actually do something. 5-10 points per trade. Did better with the the MNQ today for sure.
I have been in and out all week with appointments for my Son. So today I have just traded the MNQ. Small 5 point trades. So today 40 points so far. Which is not that big of a deal with the small tick size of the MNQ. I am just getting used to the MNQ. So only trading 2 Micro lots. But happy with the process so far.
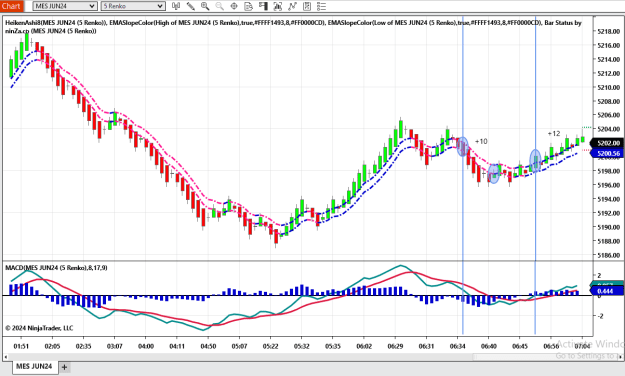
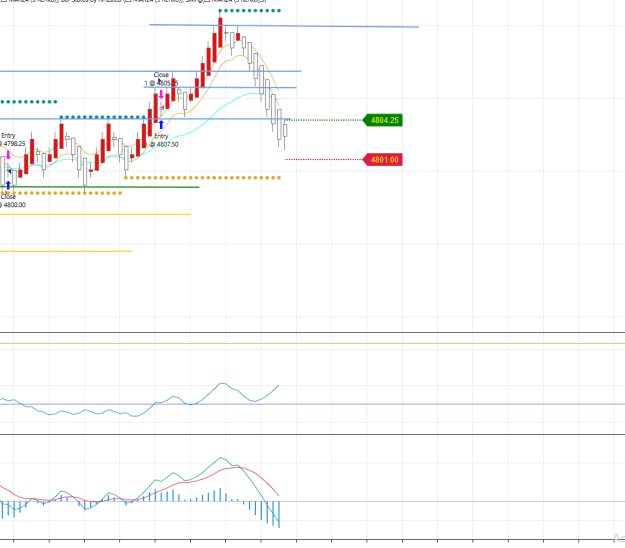
Hey rocky I have been backtesting your strategy for around 3 months now and I wanted to ask this question. How would you have entered this since I believe their were simply to many resistance zones to feel comfortable entering would you have stayed out or entered elsewhere?
Hey rocky I have been backtesting your strategy for around 3 months now and I wanted to ask this question. How would you have entered this since I believe their were simply to many resistance zones to feel comfortable entering would you have stayed out or entered elsewhere? {image}
Ignored
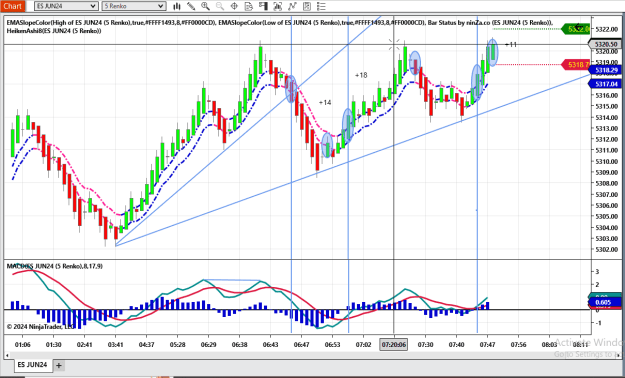
Could you please Post a larger chart(about 4 hours of PA) and have the chart with the time so I know when you were trading.
Sorry to be a pain in the ass, but what size renko, what day and this was Es? Sometimes you have to right click on chart and select reload historical data.
Sorry to be a pain in the ass, but what size renko, what day and this was Es? Sometimes you have to right click on chart and select reload historical data.
Ignored
No rocky I should be the one apologizing since I'm the one in need of help your good and as for the renko size it was 4 and the day was January 10th 2024 and yes this is ES and when I did reload the data it was defiantly different but not to different
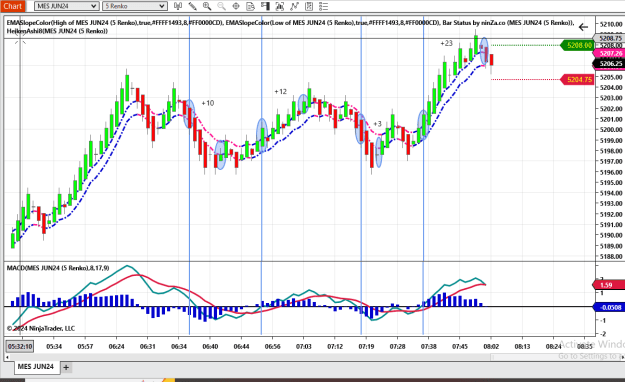
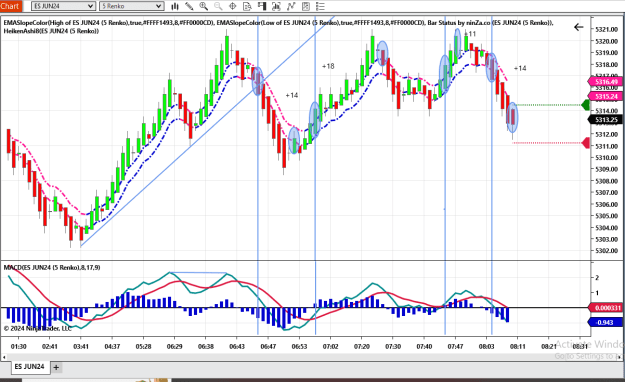
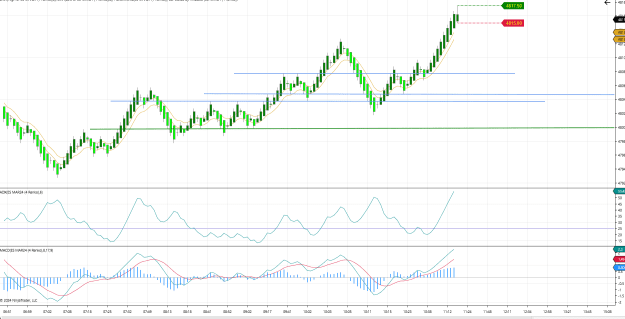
Ok first the short trade. the price structure looking a the second chart was a weakish uptrend. Meaning a strong uptrend makes higher highs and higher lows. PA
was making higher lows but not higher highs so weak uptrend. You are looking solely at horizontal S/R, Draw a trendline using the higher lows Price structure there is still intact. The swing indicator is good but sometimes it gets too busy, which is why I haven't been using it. Use trend lines instead. Also look at MACD and starting from the left at lowest X-over draw a line and you'll see macd making higher lows, then from the left side draw a line from there as macd makes lower highs. So you see PA is getting weaker. Your wait for a break out of macd from the pennant. Which can go either, in this case break to the upside.
Secpnd trade is easier. Two things number one entry was a little late by 1 candle(it happens)number two you weren't patient you entered got out probably before candle closed as a doji then price moved your way, at worst should've been a B/E. Use the MACD when you see it compressing from both sides and look for breakout of the MACD. Hope this helps.
Ok first the short trade. the price structure looking a the second chart was a weakish uptrend. Meaning a strong uptrend makes higher highs and higher lows. PA was making higher lows but not higher highs so weak uptrend. You are looking solely at horizontal S/R, Draw a trendline using the higher lows Price structure there is still intact. The swing indicator is good but sometimes it gets too busy, which is why I haven't been using it. Use trend lines instead. Also look at MACD and starting from the left at lowest X-over draw a line and you'll see...
Ignored
What do you mean by from the left at lowest X-over? and could you point out where I should draw a line on the MACD on the first trade? and as for the trendlines ill make sure to apply this from now on I appreciate the help rocky!