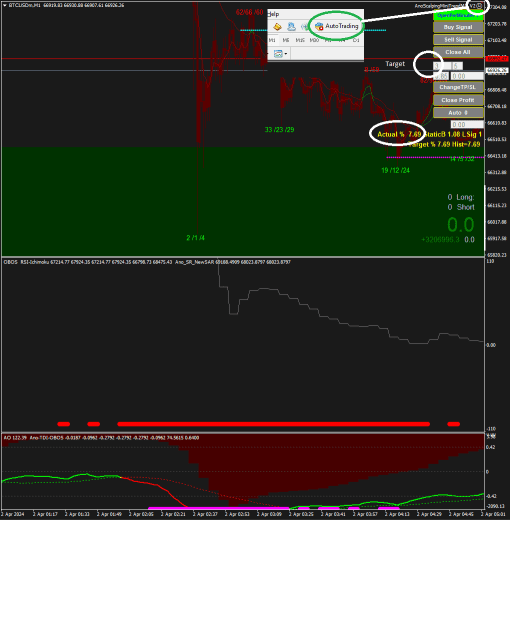
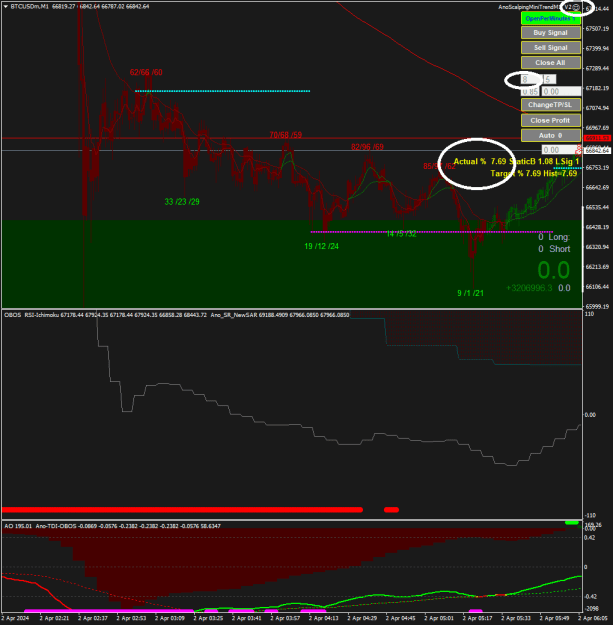
{quote} Maybe someone doesn't know, why auto trading in the tool bar can't be activated? If Actual > Target and there are no open orders.... then the AutoTrading Button on the Tool Bar will be automatic Disabled {image} So for enable AutoTrading, change the Target to be greater than Actual, then click the AutoTrading button {image}
Ignored
Yeah I know what you mean.
I'm just a old hat at trading and like to trade manually when ever possible, because trading is boring at times I like to try new things but keep it manual as possible.
Well done on the indicators though, big pat on the back buddy.
Thank You James16, Fijitrader, Mbqb1, ghous, Pinbar and Jarroo. cpfleger
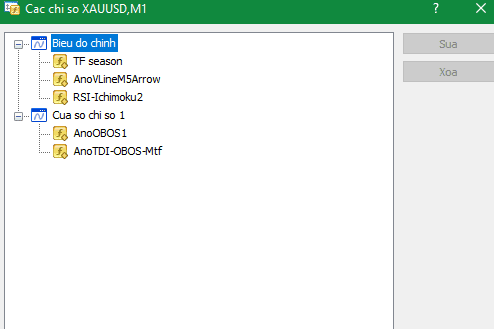
I downloaded the file and it really gave me a headache
20 ex4 files in 1 chart. too noisy
Methods are always changing
Can you omit some indi and which indi finish should you use?
I downloaded the file and it really gave me a headache 20 ex4 files in 1 chart. too noisy Methods are always changing Can you omit some indi and which indi finish should you use?
Ignored
The concept is to find a mini trend that you can understand yourself, because there is no standard method
Find mini trends in a way that is easy for you to understand, because everyone has a different understanding
The version 2 template is just one concept,
you can add or subtract what is in the Version 2 template, or combine it with an indi/system that you already understand.
The most common way to find the mini trend with the Indi in version 2 is the similarity of color
After you understand the concept of finding a mini trend on the M1 chart, the next step is to manipulate orders to gain more profit
You can manipulate orders in many ways, EA AnoScalpingMiniTrendM1 is just one way to manipulate orders from many ways
So find a concept that you can understand, and build a system that best suits you, then practice manipulating orders with your style
Remember, all of this is just speculation
Joined Oct 2022
|
Status: wa dot me +6281219780310
|811 Posts
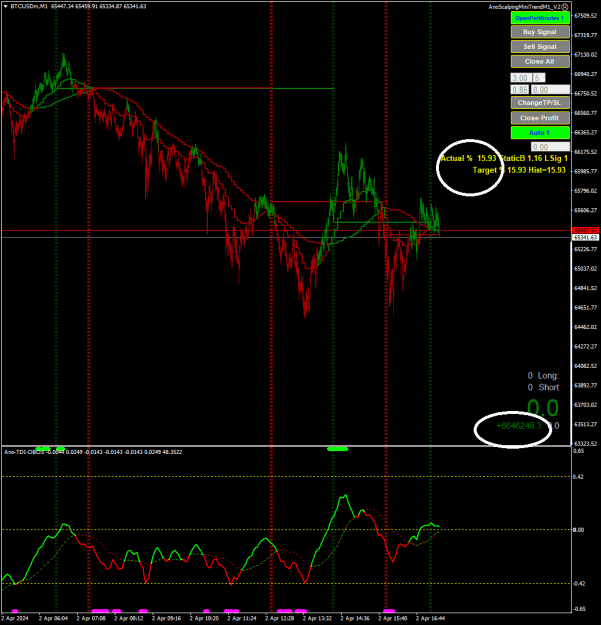
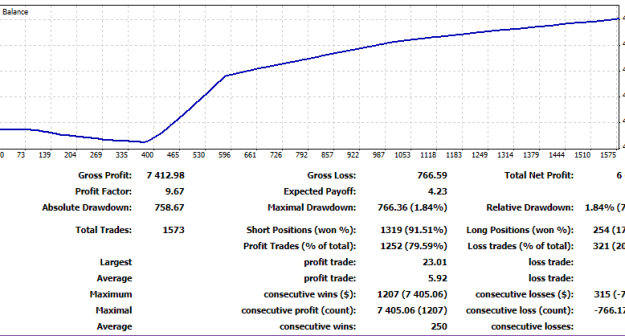
Results of 0-10% per day can only be achieved if you have the concept of finding mini trends and are able to manipulate orders
Attached Image (click to enlarge)
Today
Attached Image (click to enlarge)
If you still don't understand the concept of finding a mini trend,
then start step by step
Install the indicators in the version 2 folder one by one,
understand the color differences one by one
After that, combine 2-3 indicators that are easy for you to understand
add more until there are 4-5 indicators
then you repeat/revise the initial steps
Chỉ có thể đạt được kết quả 0-10% mỗi ngày nếu bạn có khái niệm tìm ra các xu hướng nhỏ và có thể thao túng các đơn hàng {image} Hôm nay {image} Nếu bạn vẫn chưa hiểu khái niệm này tìm một xu hướng nhỏ, sau đó bắt đầu từng bước Cài đặt từng chỉ báo trong thư mục phiên bản 2, tìm hiểu từng điểm...
Ignored
Thank you, I'm considering removing some indicators to reduce clutter
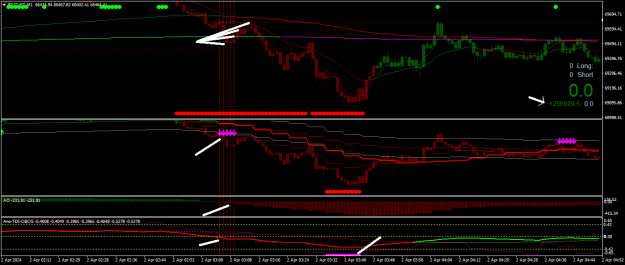
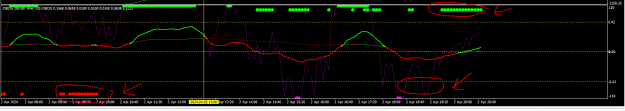
Can you tell me: what does the green/red dot represent?
And what does the purple line represent?
{quote} Thank you, I'm considering removing some indicators to reduce clutter Can you tell me: what does the green/red dot represent? And what does the purple line represent? {image}
Ignored
Green Dot ..... CCI>= 100
Red Dot......... CCI<=-100
purple line = CCI betwen +100 and -100
CCI level 0 = TDI level 0
level 0.42 for CCI = 0.42*160 =67.2
general theory for CCI
If the previous CCI was greater than 100 and the current CCI is smaller than 100 then you should close buy
If the previous CCI was smaller than -100 and the current CCI is greater than -100 then you should close sell
Joined Oct 2022
|
Status: wa dot me +6281219780310
|811 Posts
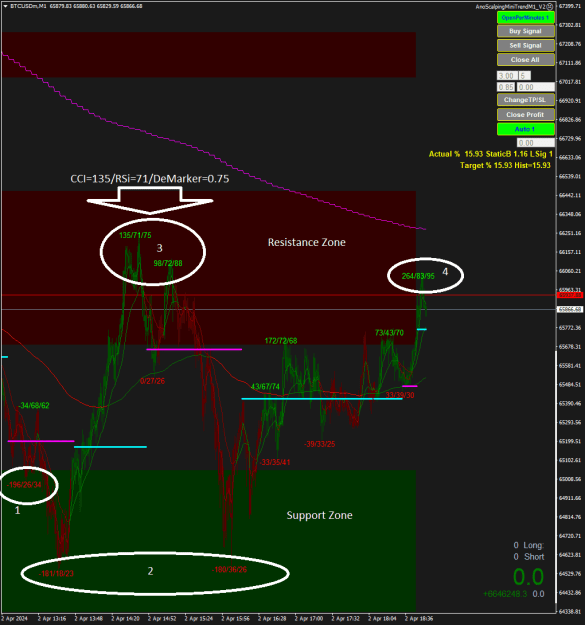
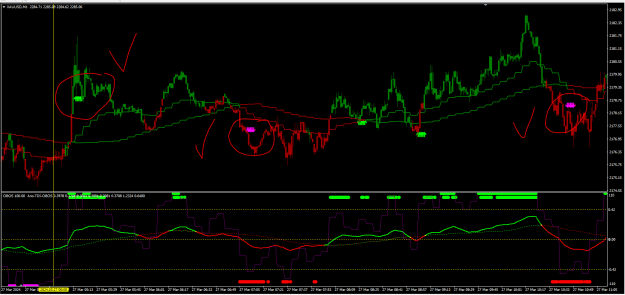
CCI-RSI-DeMarker on Support-Resistance Zone
It's all just speculation
1 CCI-RSI-DeMarker = OverSold in the Support Zone, But the price only rose slightly and fell again
2 CCI-RSI-DeMarker = OverSold at the Support Zone, price rises to the Resistance level
3 CCI-RSI-DeMarker = OverBought at the Resistance Zone, price falls to the Support level
4 CCI-RSI-DeMarker = OverBought at Resistance Zone......Where are you going
Attached Image (click to enlarge)
Value will be repaint , switch M1-M5-M1 for fix
This indicator is an additional filter for Version 2 if you can use it
What is your input to improve the display so that it is easier to understand? {image}
Ignored
1.) Remove all the lines, colors, indicator output and sub windows so the main chart window shows price and time and nothing else. Why do charts always have to look like xmas trees (or even worse). There is only price and time. The indicators are all based on history. There is no predictive value here that is telling you anything else than what already happened so why showing it?
2.) IF there is a valid buy/sell signal according to your rules (and only then) mark it by a green/red arrow or a simple text line with text saying buy/sell here. It should be fixed and not repainting the final signal to the chart. The signal should already be confirmed“ at this time. If you need confirmation or even confirmation for the confirmation why not instruct your algorithm to find this out in silent mode? Again, why cluttering the chart with unnecessary extra information. Wait, Buy, Sell, Exit, Wait. That’s all needed!
3.) Maybe write an EA according to the systems rule’s that is able to follow all of the signals (not only the cherry picked ones at everyone’s own discretion) and opens an order for every valid buy/sell signal signal following what ever risk/reward formula. This would make it easier and objective for people (like me) to find out the „system“ ever showed to have a positive expectancy over x time period (at least over the past…).
{quote} Chấm xanh..... CCI>= 100 Chấm đỏ......... CCI<=-100 đường màu tím = CCI giữa +100 và -100 CCI cấp 0 = TDI cấp 0 cấp 0,42 cho CCI = 0,42*160 =67,2 lý thuyết chung cho CCI Nếu CCI trước đó lớn hơn 100 và CCI hiện tại nhỏ hơn 100 thì bạn nên đóng lệnh mua Nếu CCI trước đó nhỏ hơn -100 và CCI hiện tại lớn hơn -100 thì bạn nên đóng bán để...
Ignored
I reviewed the history
When the arrow appears, almost 100% of the blue/red dots also appear
and then, the price reverses
{quote} 1.) Remove all the lines, colors, indicator output and sub windows so the main chart window shows price and time and nothing else. Why do charts always have to look like xmas trees (or even worse). There is only price and time. The indicators are all based on history. There is no predictive value here that is telling you anything else than what already happened so why showing it? 2.) IF there is a valid buy/sell signal according to your rules (and only then) mark it by a green/red arrow or a simple text line with text saying buy/sell here....
Ignored
1. Yes, you can delete indicators that you don't need, only use those that are necessary and that you can understand
2. There will be no such thing as a valid signal, the indicator always follows the price,
the price is created by the transactions of billions of people in the world ,so no one is able to formulate it
Why ? humans have instincts, madness etc
that's why albert einstin said "scientists can count billions of stars in the sky, but not for human madness "
so we all only have hope from speculation, luck is always number one
3. Because of point number 2 above, there will be no EA as you expected
{quote} maybe you are not careful enough, arrows and dots may often appear together but not 100% especially the price has reversed
Ignored
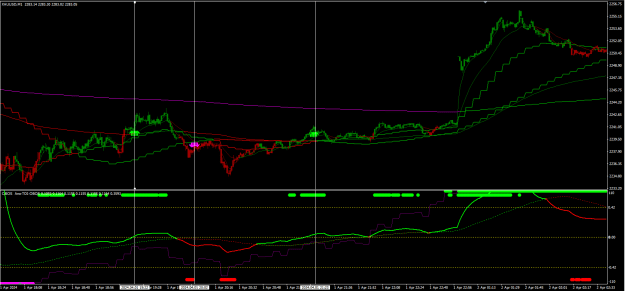
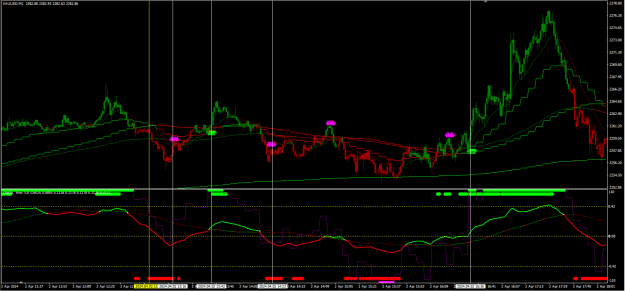
Currently I only use these indicators to reduce confusion
I have 3 entry points according to my understanding.
1. arrow appears
2. The color of the TDI is the same as the arrow color
3. The candle color trend is the same as the color of the TDI and the arrow
Is it correct if I enter an order like that?
1. Yes, you can delete indicators that you don't need, only use those that are necessary and that you can understand 2. There will be no such thing as a valid signal
Ignored
And that's exactly where I see the problem.
Instead of all the vertical, horizontal and squiggly lines that are supposed to signal something, why not just give ONE definitive signal where you should buy or sell. Of course I can remove all the indicators, but then you would obviously be able to remove the entire "system" as such. Or rather say, the indicators. For me, a system is something as a whole and not just individual pieces of the puzzle, but I'm not used to anything else from this forum, so it's all good. No offense.
so we all only have hope from speculation, luck is always number one 3. Because of point number 2 above, there will be no EA as you expected
Ignored
I do not think so. Luck and speculation (although certainly helpful) should have no meaning in the long term. A profitable system should be built on a solid plan like any other business. Only amateurs and gamblers who don't know what they are doing rely on luck and hope.
May I ask why your charts show so many individual orders? What's the point behind it? Is this to make the brokers happy so that they can earn as much as possible in fees or does it have some deeper meaning. Isn't it enough in your "system" to place a single order when you receive a signal?
Well, what do I know? I only have the yellow diamond after my nickname I wonder what you have to do here to get a red diamond. Trading experience doesn't seem to play a role.
Darwati, I think Your TDI and RSI_Ichimoku Lines are anough. If You can tell the settings of Your TDI i'll be happy. I don't need squigglys. Only TDI and Ichimoku Lines.
{quote} And that's exactly where I see the problem. Instead of all the vertical, horizontal and squiggly lines that are supposed to signal something, why not just give ONE definitive signal where you should buy or sell. Of course I can remove all the indicators, but then you would obviously be able to remove the entire "system" as such. Or rather say, the indicators. For me, a system is something as a whole and not just individual pieces of the puzzle, but I'm not used to anything else from this forum, so it's all good. No offense. {quote} I do...
Ignored
I'm just an amateur and a gambler, that's very clear
what's wrong with being an amateur and a gambler?
You should understand from the start, because I have mentioned speculation and gambling at the beginning
1000 orders Lot 0.01 = 1 order Lot 10
As far as I know, Yellow/Red diamond is just an automatic reader ranking, FF never gives appreciation in material form to readers with any ranking,
for me whatever the ranking is, it's useless
Everyone has a different concept, and my concept as an amateur is a gambler, because I hope for luck from speculation
{quote} Currently I only use these indicators to reduce confusion I have 3 entry points according to my understanding. 1. arrow appears 2. The color of the TDI is the same as the arrow color 3. The candle color trend is the same as the color of the TDI and the arrow Is it correct if I enter an order like that? {image} {image}
Ignored
Yes, in theory it's like that, but that's just speculation, because not all conditions that are confirmed will produce a profit
Darwati, I think Your TDI and RSI_Ichimoku Lines are anough. If You can tell the settings of Your TDI i'll be happy. I don't need squigglys. Only TDI and Ichimoku Lines. Thank You.
Ignored
Ok, if I have time I will change the TDI and share it