{quote} Can you explain more detail about the targeting? When to H1-ema and when to next H1-ema swing level? Thank Alan!
Ignored
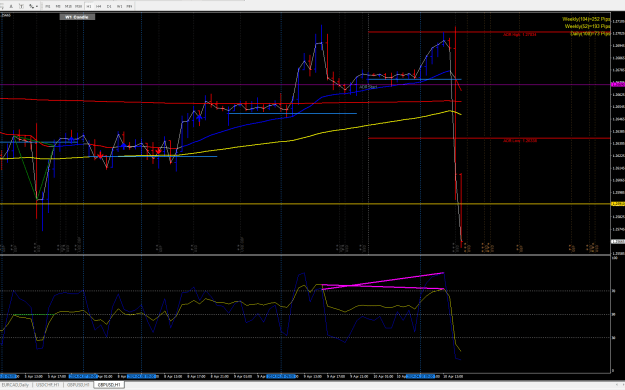
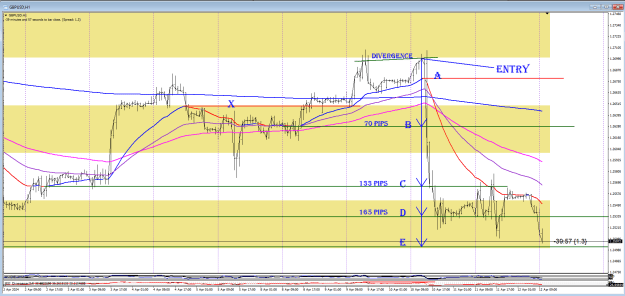
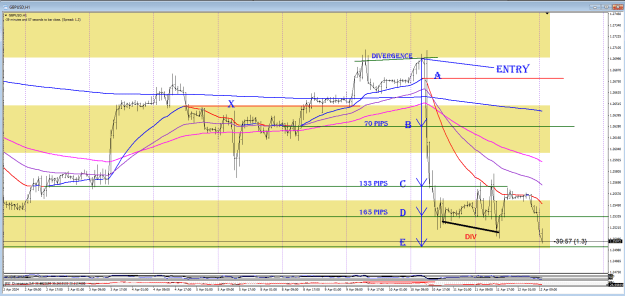
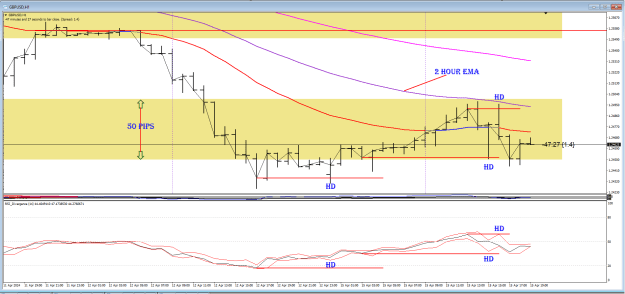
This is a big question but maybe a refresher is needed. Glad you picked the 1-hour chart because there is not too much to explain there.
The first this is I use a red horizontal for the average tops and a green horizontal for the average bottoms.
I have the EMA averages of the 1H, 2H, 4H and the daily on this one chart. This provides the classic rainbow rollover of averages.
The grid on this chart is 50 pips wide.
No other indicator is needed to trade this method.
We have to work out by analysis what has transpired on the chart.
The lines A, B, C, D and E are this analysis. The line x has been broken so this can be deleted from the chart being redundant.
Attached Image (click to enlarge)
We have a bear divergence at the top to give us our entry and we can see the nearest target average swing low (B) is 70 pips away.
Now we do the math and let 70 pips equal 2% to work out our entry lot size. The initial stop would then be 35 pips or 1%. This is a great trade to be in because the lot size required leaves us plenty of money to add to the position. Even if we let this single trade run to D we make more than 8% profit.
Currently the price has tested D several times and now the EMA has broken C so price should test the next level E.
Why didn't the price stop at B or even C. Well, we can see these levels have already been tested previously.
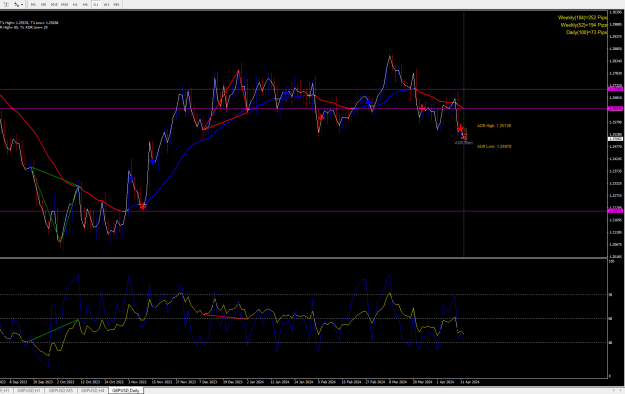
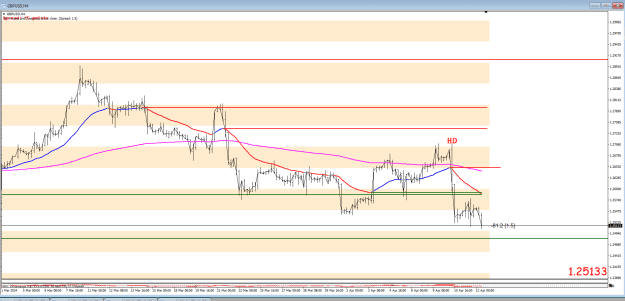
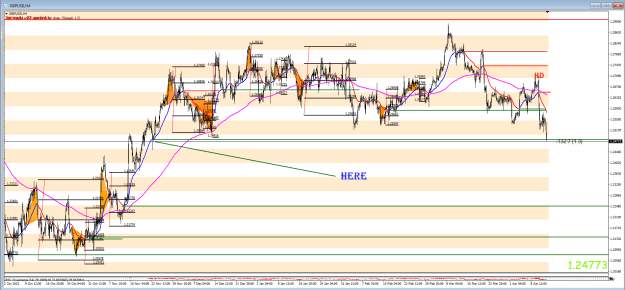
The higher the time frame the longer it takes for the charts to set up. Guess what this 4-hour chart is going for? {image} A bull divergence could easily stop it.
Ignored
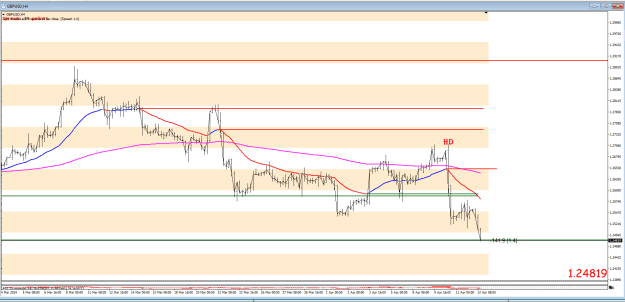
Hey Al, daily average is at last EMA swing as well. Is this thing heading to 1.22071?
Joined Apr 2019
|
Status: Member
|1,737 Posts|
Online Now
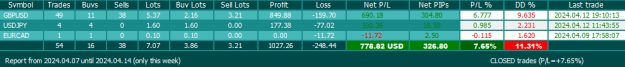
A good trading week at 7.65% with a few trades on UJ to boot.
Demo account now doubled to 10K since 1st Nov 2023. Still making some duff trades but overall happy with progress to date.
{quote} This is a big question but maybe a refresher is needed. Glad you picked the 1-hour chart because there is not too much to explain there. The first this is I use a red horizontal for the average tops and a green horizontal for the average bottoms. I have the EMA averages of the 1H, 2H, 4H and the daily on this one chart. This provides the classic rainbow rollover of averages. The grid on this chart is 50 pips wide. No other indicator is needed to trade this method. We have to work out by analysis what has transpired on the chart. The lines...
Ignored
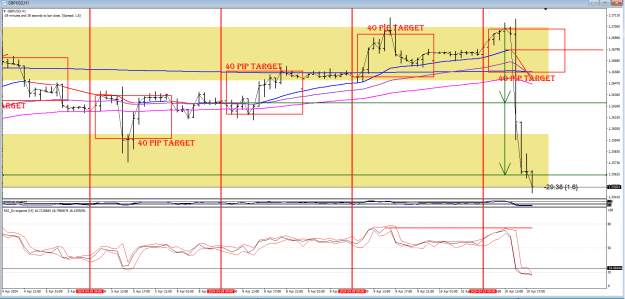
I apologize for my slow understanding. Could you please assist me with this?
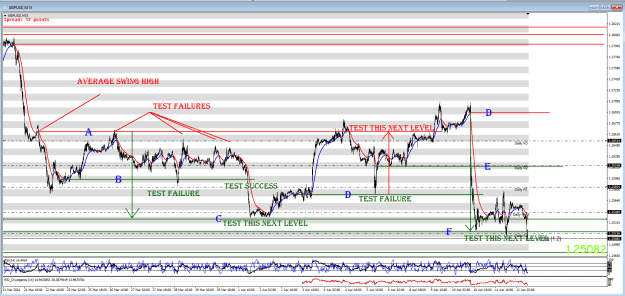
How about the bull-div at the E level. Where should I target, to the H1-ema or to A-level.
Thank Alan!
{quote} Hi Kev, my Skype has now changed, and I have lost all my contacts from previous. Also, all the email records I had are also gone into the digital black hole. Send me a private post with your email and I will establish a new connection.
Ignored
Hi Alan good to hear youre Okay and still going strong .. I have dropped you a DM
{quote} I apologize for my slow understanding. Could you please assist me with this? How about the bull-div at the E level. Where should I target, to the H1-ema or to A-level. Thank Alan!{image}
Ignored
Remember a divergence only returns the price to the average, if it doesn't then it will make a LL (in this case). What you are hoping for is that not only does price make the EMA but also crosses it and finds support to take it back the average swing high level.
If your bull divs are not crossing the EMA then better to watch for bear divs continuing the downwards move.
{quote} Remember a divergence only returns the price to the average, if it doesn't then it will make a LL (in this case). What you are hoping for is that not only does price make the EMA but also crosses it and finds support to take it back the average swing high level. If your bull divs are not crossing the EMA then better to watch for bear divs continuing the downwards move.
Ignored
Alan, could you please provide me with a detailed explanation of your process for analyzing price and determining your trading action if you have a long position from that bull-div?
Thank you.
{quote} Alan, could you please provide me with a detailed explanation of your process for analyzing price and determining your trading action if you have a long position from that bull-div? Thank you.
Ignored
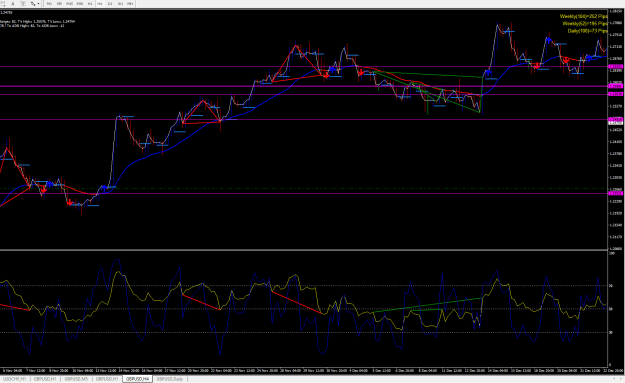
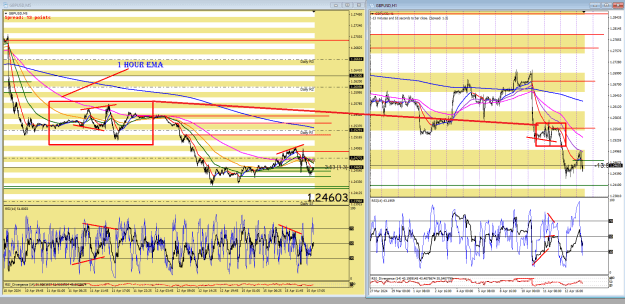
OK we have a bull div in this case, it should at least return price to the EMA which is in itself quite a few pips for the taking, some 40 pips or so.
This is best viewed at the 5 min level where we see a bull div take price back to the 1-hour EMA. BUT, look what happens!
Price runs into a bear div so expect a LL than the previous bull div some 60 pips or so.
See the charts below in the red boxes.
Attached Image (click to enlarge)
Even now price cannot hold support above the EMA and on the 5 min we see it test the average swing low from a bear div.
Is there something about this you don't understand?
{quote} OK we have a bull div in this case, it should at least return price to the EMA which is in itself quite a few pips for the taking, some 40 pips or so. This is best viewed at the 5 min level where we see a bull div take price back to the 1-hour EMA. BUT, look what happens! Price runs into a bear div so expect a LL than the previous bull div some 60 pips or so. See the charts below in the red boxes. {image} Even now price cannot hold support above the EMA and on the 5 min we see it test the average swing low from a bear div. Is there something...
Ignored
Thank Alan.
Sometimes it's easier to ask, but I've learned that getting my hands dirty first is the best way to truly understand what's needed.