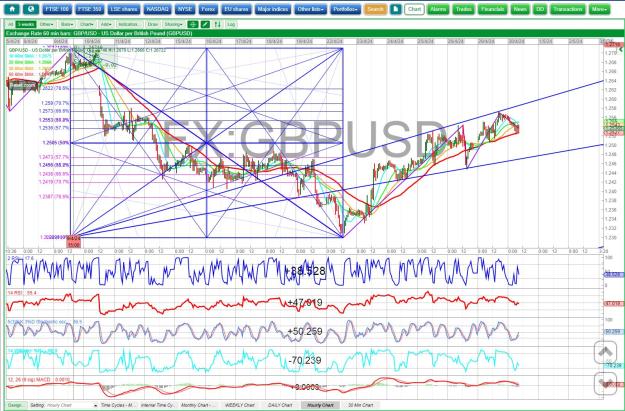
I'll shove this here - its Gann/Jenkins esq sort of
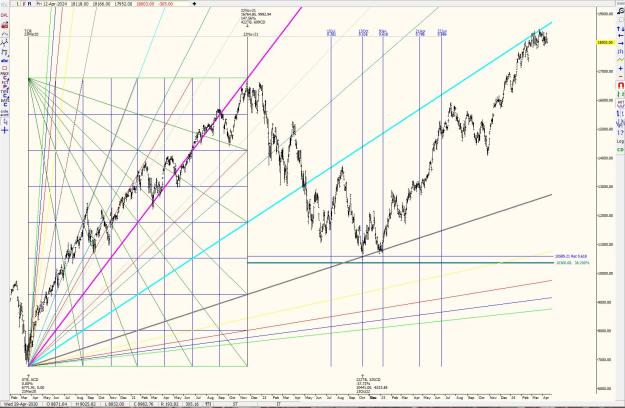
Nasdaq100 from 2020 rally
See how everything fits together?
Draw the Gann Box around price action / Draw Gann Angles using the 1 x 1 as the diagonal of the box / run retracements AND also GEOMETRIC % declines from the high - THEN run TIMING of the Gann Box
For numerous reasons we were looking for an OCTOBER LOW turning point
52.6% is an INTERNAL RATIO related to the FIBONACCI group - Its INVERSE is 190.2% which is the DIAGONAL of a GOLDEN RECTANGLE
I just love it when all this comes together to the DAY and right bang on angles and retracement levels
Attached Image (click to enlarge)
THT
2