smjones and wtb,
I can only underline what phil is explaining.
It is the very same as what I teach people in my room every day.
The way I explain it as follows:
WTB said in his first posting :
...
Meaning to have an indicator or a method to filter out the trend from the consolidation. Because we all know it is better to pick up a trade in a trend then to try to catch a trend from a consolidation.
People want to depends on indicators to tell them if there is trend or no trend or strong trend etc...
Try to open your minds now.
Price itself is THE most important indicator itself. There is no lag.
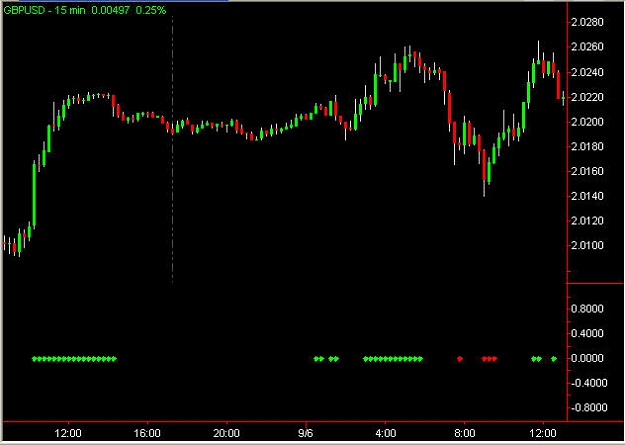
But 99% of the indicator that use a value is actualy a moving average that is taken in the calculation. Same goes for this slow stochastic that is shown in the previous posting. That means that it lags. problem is also that it needs to move between bounderies ( between 100 and 0) as so many other indicators. That has as effect if the trend is so strong that at some point the indicator will be at the extreem and there is no other way then to come back down in a up trend or to go back up in a down trend. So that means that the indicator is doing the opposite of what price is doing.
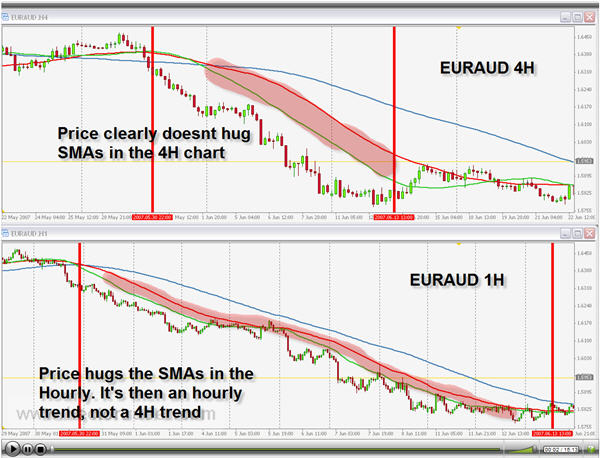
Methods who are using 1 or several MA's to identify the trend will have as effect that in a consolidation market with a bit bigger waves it will continiously show you an up trend at the top of a move and a down trend and the bottom were price just finished.
If one uses an indicator for ex. like yours or semilar indicators it will have the tendency to ALWAYS show you a trend. It will always have a bias in up or down (rarely it will say neutral bias)
To bring it back to what phil was saying higher highs or lower lows....
As WTB said: methods to filter out trending vs. non-trending markets when it comes to sniff around for a trade.
If the trend is clear (and it doesn't matter on wich time frame because one can take it from a 60min chart an other from a 5 minute chart) to "sniff around for a trade", that pattern of higher highs and lower lows will occur on every time frame.
Now important: if this happens in a clear way then there is a clear trend.
The problem is that people would like to know the bias continiously. And this is the beauty of this very effective but simple technique if at some point you don't see it in a clear way anymore because some lower high and then a higher bottom and retracing back etc...then that means there is NO TREND.
The moment that you say to yourself damm this is difficult to spot well that should be your neutral bias. Difficult to spot or you don't see it means automaticly that there is no trend. Meaning that you stay away from it.
I know it sounds to simple and that you would like to hear about some new indicator or technique. But just for fun maybe in the weekend if you have a couple of hours free. Take some charts with no indicators on it what so ever. Go back somewhere in historie and scroll forworths very slowely (with MT4 one can do tick by tick with the F12 button).
And put this simple aproach to the test and I promisse you that you will be amazed from what you see or the conclusions that you make. Don't quit after 10min Do it severall hours till you have the hang of it.
Again when it frustrates you because you do not see the trend or you find it hard to spot the trend then that means do not trade.
In the room they ask me very often igor could you help me on tracing the trend on the 5 min chart. I tell them emmiadiatly if I need to help you it is because it is not clear. If it is not clear then there is no trend.
I believe that price itself is the most important indicator in a traders tool box. But many traders seem to forget about that tool. They want to replace it by other tools that actually take the most important tool (price) as base for their calculations.
If price goes clearly up why do I need an indicator to tell me that there is a strong up trend ...if I can see that for myself.
The problem is that most traders try to spot a trade from the very beginning.
If you only take action when the trend is clear in this way higher highs lower lower lows then it is not full proof but you will see that will stay away more from false trades.
With the same technique I place also my stoplosses that in this way make a lot more sence then a fix pip stoploss.
In this price reading I develloped also a few price patterns if they occure is is better to stay away from it.
As a tennis ball pattern, were highs and lows are getting smaller and smaller (fits most of the time in a triangle) or a news bar pattern were before news price makes a little high and with news comes heavy down and then retraces back up. As long price then stays between this little high before the news and the low you better stay away from it (oposite for a reaction on news to the upisde)
A top-retracement and bottom-retracement pattern: If during the day price continously goes up. Somewhere in the US session it makes a high and then starts to retrace a bit. Very frequently you will see that price will stay for hours sometimes up to 2-3 days between that high and the bottom of that retracement (same goes for big moves to the downside). As long if price stays within that range you will see the same effect of very hard or nearly impossible to spot higher bottoms or lower tops. So stay away from it.
So this technique is doing exactly what WTB said: filter out trending vs. non-trending markets.
But I can understand that severall people are not helped with this technique because it is not applicable in mecanical trading systems or one can not define them als rules for an EA or in an indicator.
I know for many people it is not "sexy" enough but used as a discretionary trader it is a charm (again when it frustrates there is no trend)
I never found an indicator that can beat this technique in reliability.
regards...iGoR
PS. If you want to do a bit of home work for that technique to make it visualy a little bit more appealing then you can place a heiken-ashi bar and a HULL MA 15 on it (doesn't matter wich time frame, from 5min to weekly)
I can only underline what phil is explaining.
It is the very same as what I teach people in my room every day.
The way I explain it as follows:
WTB said in his first posting :
QuoteDislikedmethods to filter out trending vs. non-trending markets when it comes to sniff around for a trade
Meaning to have an indicator or a method to filter out the trend from the consolidation. Because we all know it is better to pick up a trade in a trend then to try to catch a trend from a consolidation.
People want to depends on indicators to tell them if there is trend or no trend or strong trend etc...
Try to open your minds now.
Price itself is THE most important indicator itself. There is no lag.
But 99% of the indicator that use a value is actualy a moving average that is taken in the calculation. Same goes for this slow stochastic that is shown in the previous posting. That means that it lags. problem is also that it needs to move between bounderies ( between 100 and 0) as so many other indicators. That has as effect if the trend is so strong that at some point the indicator will be at the extreem and there is no other way then to come back down in a up trend or to go back up in a down trend. So that means that the indicator is doing the opposite of what price is doing.
Methods who are using 1 or several MA's to identify the trend will have as effect that in a consolidation market with a bit bigger waves it will continiously show you an up trend at the top of a move and a down trend and the bottom were price just finished.
If one uses an indicator for ex. like yours or semilar indicators it will have the tendency to ALWAYS show you a trend. It will always have a bias in up or down (rarely it will say neutral bias)
To bring it back to what phil was saying higher highs or lower lows....
As WTB said: methods to filter out trending vs. non-trending markets when it comes to sniff around for a trade.
If the trend is clear (and it doesn't matter on wich time frame because one can take it from a 60min chart an other from a 5 minute chart) to "sniff around for a trade", that pattern of higher highs and lower lows will occur on every time frame.
Now important: if this happens in a clear way then there is a clear trend.
The problem is that people would like to know the bias continiously. And this is the beauty of this very effective but simple technique if at some point you don't see it in a clear way anymore because some lower high and then a higher bottom and retracing back etc...then that means there is NO TREND.
The moment that you say to yourself damm this is difficult to spot well that should be your neutral bias. Difficult to spot or you don't see it means automaticly that there is no trend. Meaning that you stay away from it.
I know it sounds to simple and that you would like to hear about some new indicator or technique. But just for fun maybe in the weekend if you have a couple of hours free. Take some charts with no indicators on it what so ever. Go back somewhere in historie and scroll forworths very slowely (with MT4 one can do tick by tick with the F12 button).
And put this simple aproach to the test and I promisse you that you will be amazed from what you see or the conclusions that you make. Don't quit after 10min Do it severall hours till you have the hang of it.
Again when it frustrates you because you do not see the trend or you find it hard to spot the trend then that means do not trade.
In the room they ask me very often igor could you help me on tracing the trend on the 5 min chart. I tell them emmiadiatly if I need to help you it is because it is not clear. If it is not clear then there is no trend.
I believe that price itself is the most important indicator in a traders tool box. But many traders seem to forget about that tool. They want to replace it by other tools that actually take the most important tool (price) as base for their calculations.
If price goes clearly up why do I need an indicator to tell me that there is a strong up trend ...if I can see that for myself.
The problem is that most traders try to spot a trade from the very beginning.
If you only take action when the trend is clear in this way higher highs lower lower lows then it is not full proof but you will see that will stay away more from false trades.
With the same technique I place also my stoplosses that in this way make a lot more sence then a fix pip stoploss.
In this price reading I develloped also a few price patterns if they occure is is better to stay away from it.
As a tennis ball pattern, were highs and lows are getting smaller and smaller (fits most of the time in a triangle) or a news bar pattern were before news price makes a little high and with news comes heavy down and then retraces back up. As long price then stays between this little high before the news and the low you better stay away from it (oposite for a reaction on news to the upisde)
A top-retracement and bottom-retracement pattern: If during the day price continously goes up. Somewhere in the US session it makes a high and then starts to retrace a bit. Very frequently you will see that price will stay for hours sometimes up to 2-3 days between that high and the bottom of that retracement (same goes for big moves to the downside). As long if price stays within that range you will see the same effect of very hard or nearly impossible to spot higher bottoms or lower tops. So stay away from it.
So this technique is doing exactly what WTB said: filter out trending vs. non-trending markets.
But I can understand that severall people are not helped with this technique because it is not applicable in mecanical trading systems or one can not define them als rules for an EA or in an indicator.
I know for many people it is not "sexy" enough but used as a discretionary trader it is a charm (again when it frustrates there is no trend)
I never found an indicator that can beat this technique in reliability.
regards...iGoR
PS. If you want to do a bit of home work for that technique to make it visualy a little bit more appealing then you can place a heiken-ashi bar and a HULL MA 15 on it (doesn't matter wich time frame, from 5min to weekly)