What does everyone think about using candle patterns at significant points of support and resistance?
I notice on GBP alot of days(intraday chart..30 min or 1 hr) that price will show reversal patterns at sup/res either from the daily, weekly or even 4 hr chart.
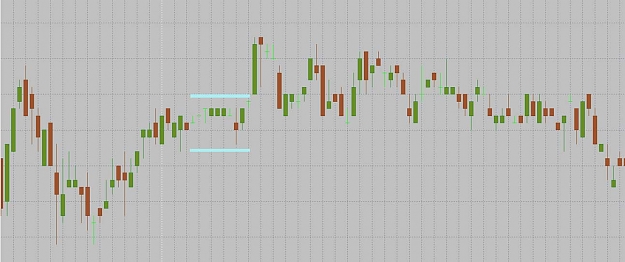
Look at posted 1 hr chart...bullish engulfing pattern on 9/7 at support and today multiple tails in support area.
opinions please!
I notice on GBP alot of days(intraday chart..30 min or 1 hr) that price will show reversal patterns at sup/res either from the daily, weekly or even 4 hr chart.
Look at posted 1 hr chart...bullish engulfing pattern on 9/7 at support and today multiple tails in support area.
opinions please!
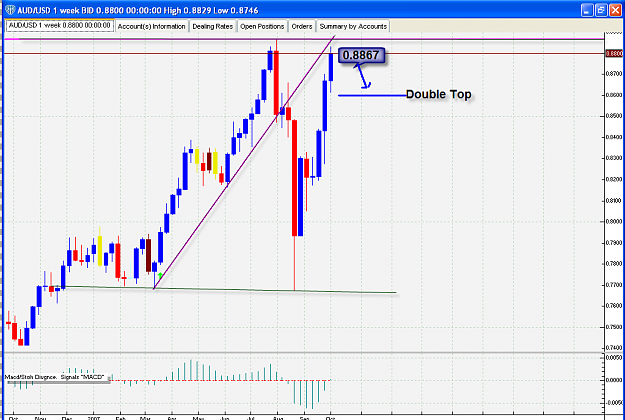
Attached Image (click to enlarge)