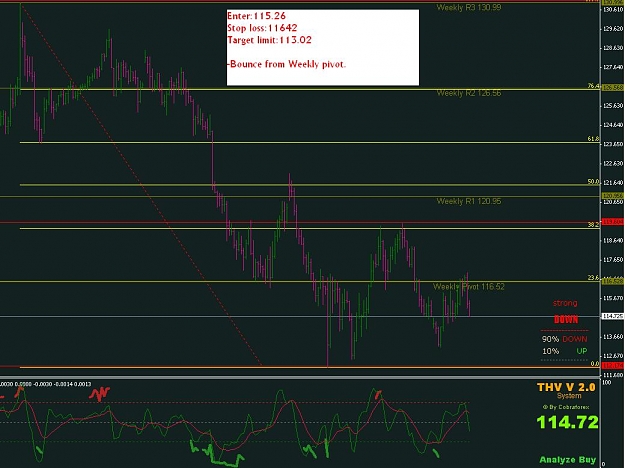
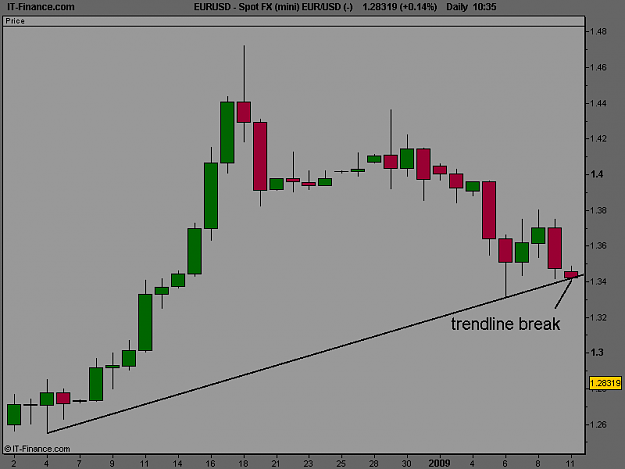
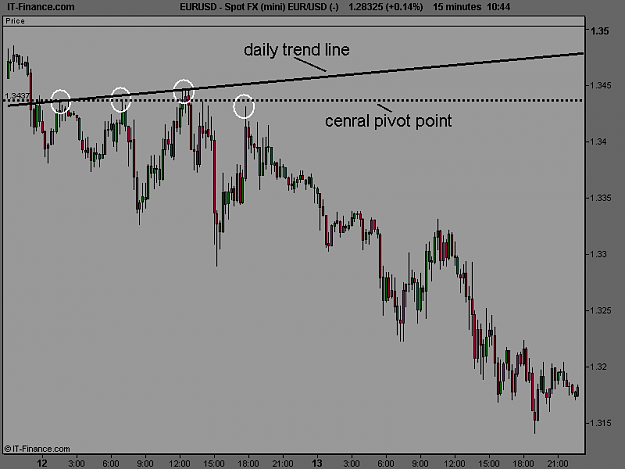
Weekly pivot points get my vote closely followed by trendlines on the daily chart. Much better than any single s/r level is a combination of one or more of them meeting at the same point, known as confluence. Here is an example of a trendline break I saw on the daily EUR/USD chart on the 11 of jan this year and then a close up of the next days price action on the 15 minute chart. The confluence of the backside of the trendline and the daily central pivot acting as resistence was too much for the panic stricken bulls. They knew they had to hold that trendline but failed on four attempts to reclaim it. This set up some very tradable price action on the day and the continuation down to todays level. Top down analysis and s/r confluence is all you've got imho
Attached Image(s) (click to enlarge)
BTC Return This Year:
12.9%