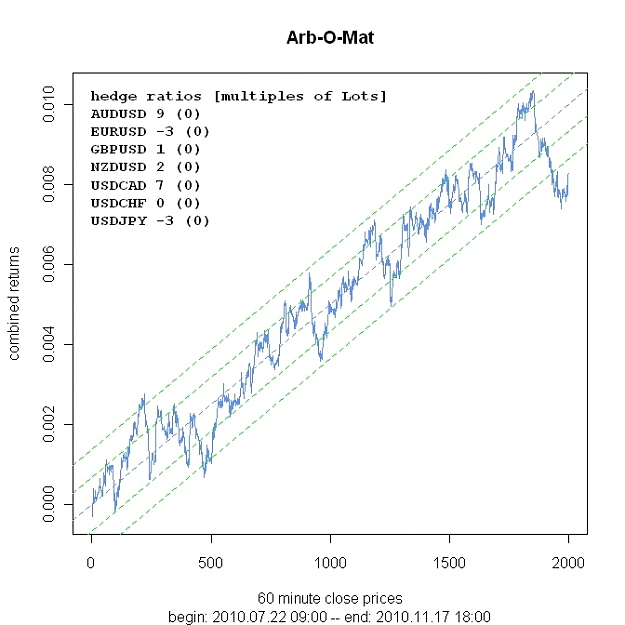
DislikedI am seeing the below chart for my terminal. Can you tell me how to trade this.. Current stddev is -4.1
Since it is -ve can I buy with those ratios showing in the chart?Ignored
btw: you can draw a vertical line into the chart and give it the name back and then you can move this line around to change the time window.
And I have noticed the following: If you switch timeframes sometimes it takes a few bars until it has loaded the recent history in all used pairs, so the last few bars might be wrong until you either wait for the next open or switch timeframes forth and back one more time.