Lets build the Fact 
here i attach 1 pic of Daily chart GBP/USD
The challenge is:
here i attach 1 pic of Daily chart GBP/USD
The challenge is:
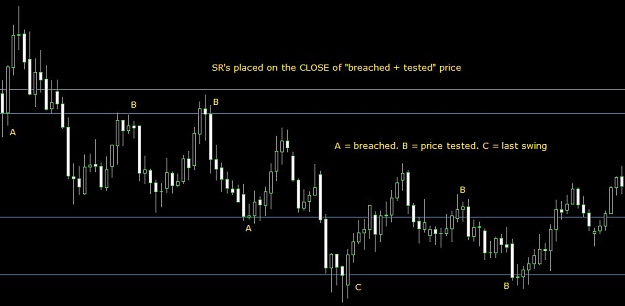
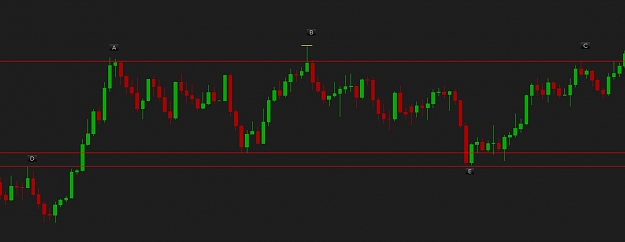
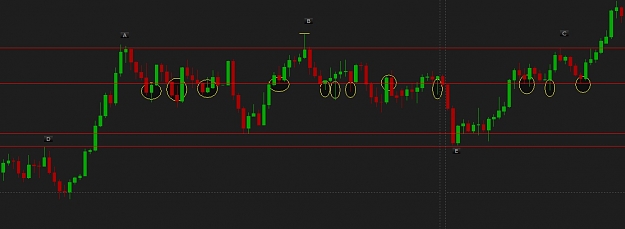
- Draw Horizontal support(s) & resistance(s) level(s)/zone(s)
- Please desribe those S/R ( i mean on what reason you take that point as S/R. Price extreems? or 3 bar reverse or what? )
I hope everyone here can be part of this
After min 10 ppl post their horizontal support resistance, i will make another thread about trendlines fact...
http://img301.imageshack.us/img301/4716/60954415.gif
this is mine
http://img261.imageshack.us/img261/6914/52714296.png