I'm starting this thread just so that I have one place to post tools that I want to share.
--------------------------------
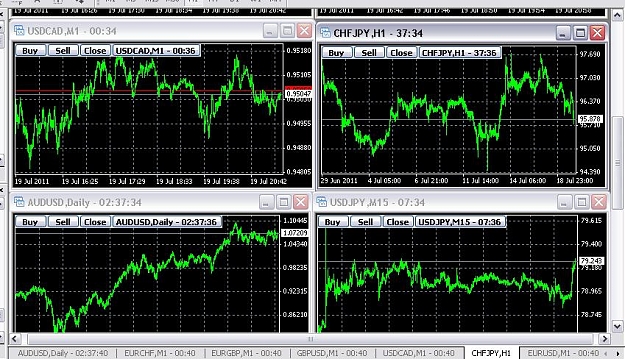
1): Bar Time (countdown to close of bar):
Displays time to close in the title bar.
It runs by the timer and do not depend on a new tick to update.
Attach to one chart and it will display countdown in all open charts.
It is a script, place the file in your \expert\script\ folder.
(The trade buttons in the picture are not included...)
--------------------------------
2): Random chart generator:
It uses true random data from random.org (atmospheric noise) to generate a random chart (both price and volume is randomized).
It has seven inputs:
"bars" - the number of bars on the char.
"digits" - number of digits after the decimal.
"avgVolume" - average volume (ticks per bar).
"tickSize" - size of one tick.
"startPrice" - the price to start chart generation from.
"symbolName" - name of the chart generated.
"refresh" - if set to true old data on the chart will be overwritten. Else we will just continue to add bars up to "bars".
(tickSize need to be "small" compared to startPrice since I don't take the lognormal ws normal issue in to account then generating prices.)
random.org may be a little slow at times: -Generating big charts can take several minutes.
Also, there is a max daily quota, 1 000 000 bits i think, so if you get an error message saying: "You have used your quota of random bits for today", just wait one day and run the script again and it will continue to add bars.
To open the chart: click files menu -> open offline | select the chart (default name is "rndChart,m2"). You may have to refresh the chart also (charts -> refresh).
It is a script, place the file in the \expert\script\ folder.
---------------------
DEMA_RSI_V1.4:
dema on rsi indicator I wrote 2 years ago.
---------------------
Added 2013-03-11:
---------------------
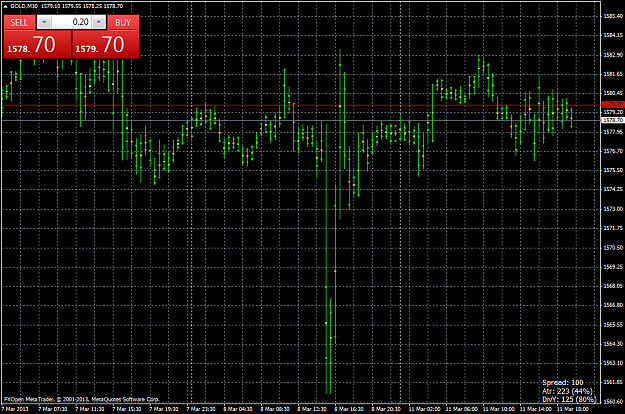
StdBars:
For me, open and close have no meaning on lower TF's (Below h4). Displaying them in a typical candle chart will just fool me in to looking for false pattens that have no real meaning. Instead I change the bar colour to the same colour as the background (black) and use this indicator in stead: It show high, low, ma & standard derivation (ma & Stdv. is calculated from the M1 data inside the bar).
---------------------
DivY:
Displays Spread, Atr & grid spacing in the lower right corner of the chart (Spread/Atr & Spread/GridSpacing i in parentheses)
---------------------
StarScroler:
A silly starwars like star scroller (spelling??) "just because I haven't done one in mql4 before".... (it's a script)
/L
--------------------------------
1): Bar Time (countdown to close of bar):
Displays time to close in the title bar.
It runs by the timer and do not depend on a new tick to update.
Attach to one chart and it will display countdown in all open charts.
It is a script, place the file in your \expert\script\ folder.
(The trade buttons in the picture are not included...)
--------------------------------
2): Random chart generator:
It uses true random data from random.org (atmospheric noise) to generate a random chart (both price and volume is randomized).
It has seven inputs:
"bars" - the number of bars on the char.
"digits" - number of digits after the decimal.
"avgVolume" - average volume (ticks per bar).
"tickSize" - size of one tick.
"startPrice" - the price to start chart generation from.
"symbolName" - name of the chart generated.
"refresh" - if set to true old data on the chart will be overwritten. Else we will just continue to add bars up to "bars".
(tickSize need to be "small" compared to startPrice since I don't take the lognormal ws normal issue in to account then generating prices.)
random.org may be a little slow at times: -Generating big charts can take several minutes.
Also, there is a max daily quota, 1 000 000 bits i think, so if you get an error message saying: "You have used your quota of random bits for today", just wait one day and run the script again and it will continue to add bars.
To open the chart: click files menu -> open offline | select the chart (default name is "rndChart,m2"). You may have to refresh the chart also (charts -> refresh).
It is a script, place the file in the \expert\script\ folder.
---------------------
DEMA_RSI_V1.4:
dema on rsi indicator I wrote 2 years ago.
---------------------
Added 2013-03-11:
---------------------
StdBars:
For me, open and close have no meaning on lower TF's (Below h4). Displaying them in a typical candle chart will just fool me in to looking for false pattens that have no real meaning. Instead I change the bar colour to the same colour as the background (black) and use this indicator in stead: It show high, low, ma & standard derivation (ma & Stdv. is calculated from the M1 data inside the bar).
---------------------
DivY:
Displays Spread, Atr & grid spacing in the lower right corner of the chart (Spread/Atr & Spread/GridSpacing i in parentheses)
---------------------
StarScroler:
A silly starwars like star scroller (spelling??) "just because I haven't done one in mql4 before"....
/L
Attached Image(s) (click to enlarge)
Attached File(s)