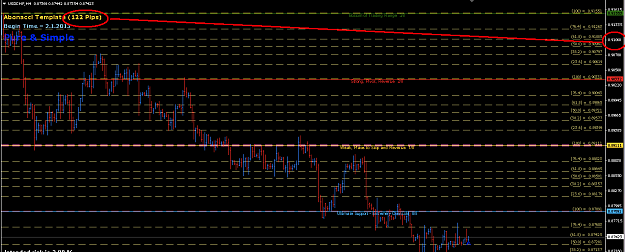
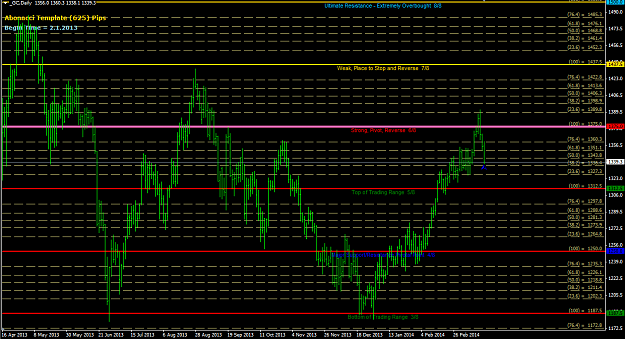
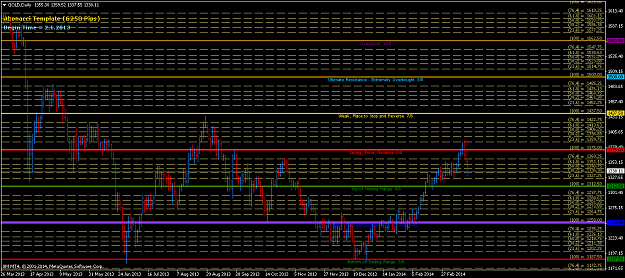
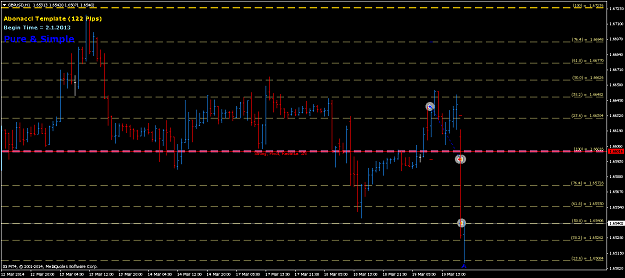
Disliked{quote} The length settings is the distance between MM levels. All we are doing is creating abonacci phases between the MM levels. If you set the MM 'P' to be for 256 (a year's trading days), then we have annual levels. As long as the 0%/100% line up with the MM Levels we can trade it. For the pairs I have tested non-yen pairs, the MM levels can be broken up into phase lengths of multiples of 122, 244, 488. For yen pairs the MM levels can be broken up into phase lengths of mutliples of 156, 312, 625. The longer the length, the bigger the phase....Ignored
I have followed Your thread from the beginning and I am still trying to figure out how to plot this MM
The original if I may say so and please correct me if I misunderstood is: Open Last year chart and plot the MM form the high to the low of the year and then in each of the MM sections plot the FIB starting from the top to the bottom of each sections of the MM. Then is up to the individual to use his own Time frame to trade. Is it right or I got it all wrong?
And also what about if one cannot plot the MM, are those number 122,244,488, and the other ones for the yen
156,312,625, doing the same job as the MM and if so from where do You start to plot them on the chart? I think I read somewhere MM has 8 sections so I see You only give 3 numbers
Most probably I am making such a mess that will confuse You.... I apologise for that just trying to learn
Have a nice day