D1 is breaking down, H4 is short with all stos adn Rsi traveling to the 20 zone and good ADX power, H1 with stochs and Rsi under 20 with full Adx power, following M5 and M1 for answers.
Hi Alien and Thiagorosa,
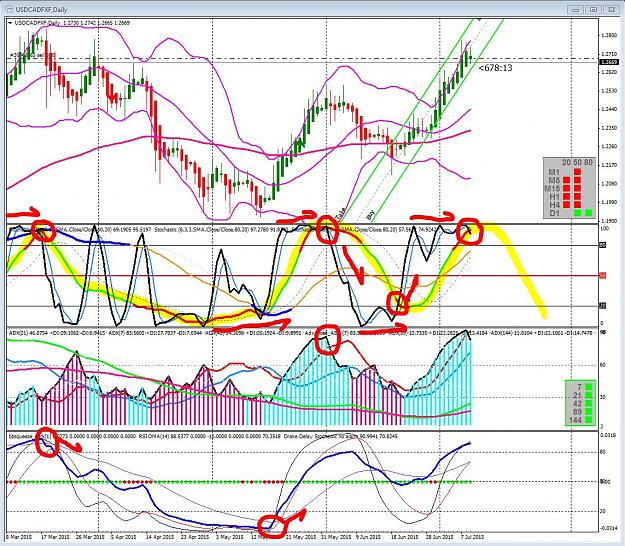
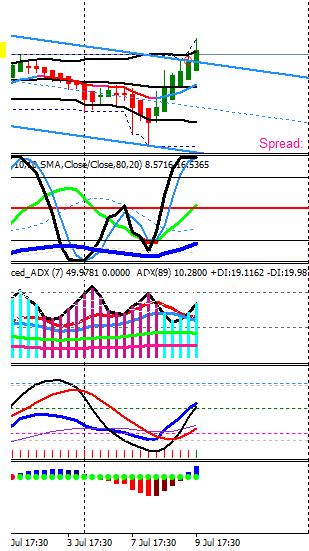
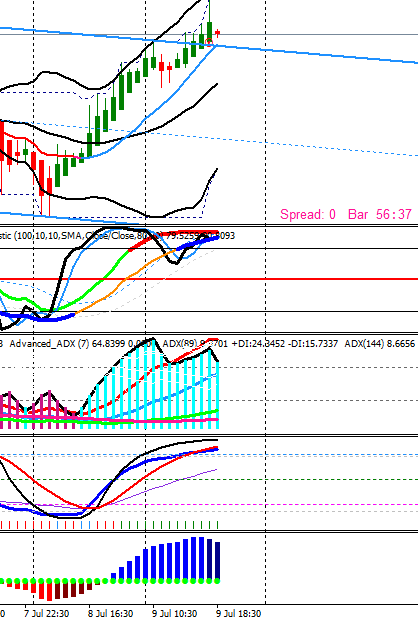
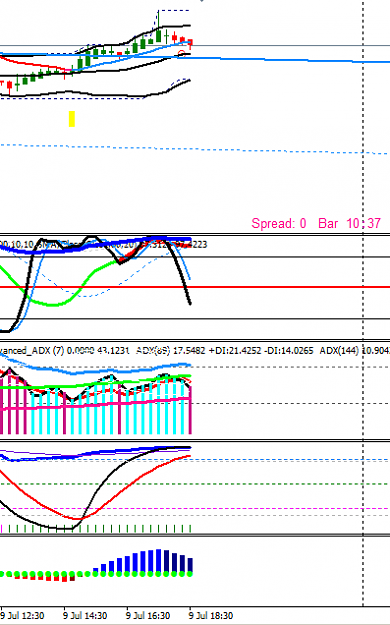
Can you confirm my understanding of the GN entry?
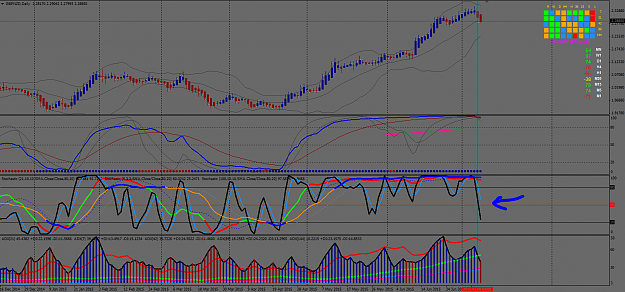
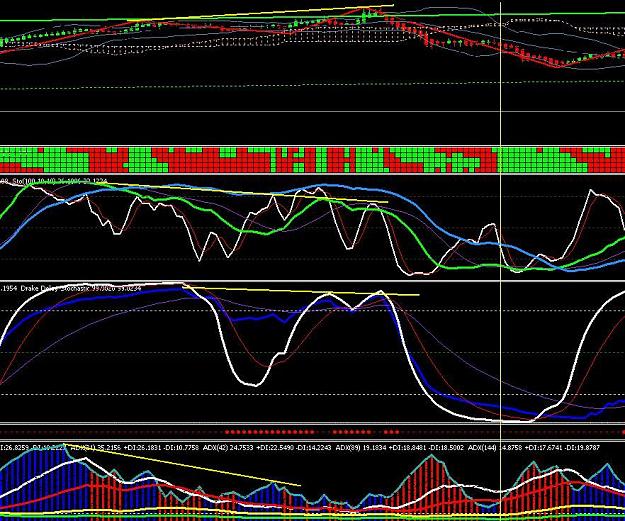
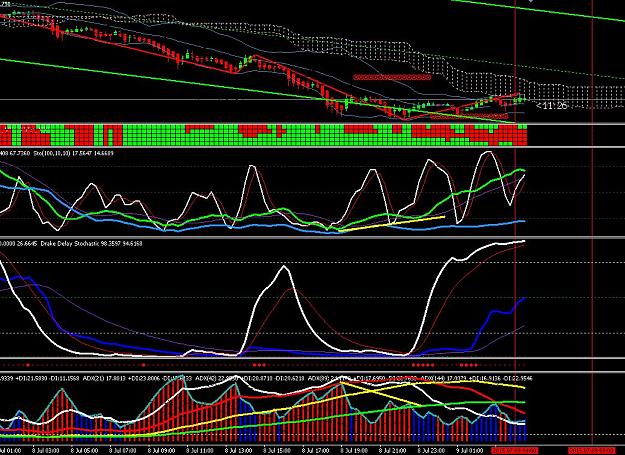
On 1h, I see that hours prior to the red vertical line, RSIOMA were coming down and all the stos were coming down. ADX were mixed.
on 4h, RSIOMA were crossing 50 as well as green sto crossing 50. I am thinking this is the main consideration for the short?
Day chart, RSIOMA still above 80, sto 8 around 70 and falling. again ADX were mixed.
Anything else that triggered your short that's important for me to grasp?
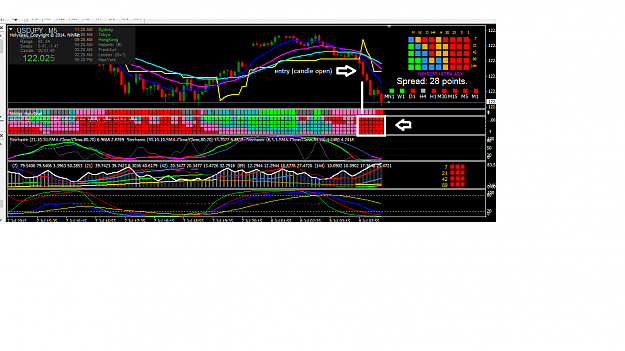
{quote} If the ADX starts to lose power at a fast pace on a Higher TF like M15 or H1, you can get a profit on the move beeing made by people taking profit or some other condition by droping down 2 TF, M1 or M5 for the example and see if there is an ADX compression before a 5 speed expansion with all stochs and Rsi crossing 50 to the other side with a good speed (angle), but the lower TF could burn you if all the other bigger TF have power against you, so be careful, just sharing an idea of how you could look at this. It will look something like...
Ignored
Oi Thiago,
Nice to finally find a brazilian guy involved with forex issues. Here in So Paulo i tryed hard meeting someone to trade ideas and experience with no sucess.
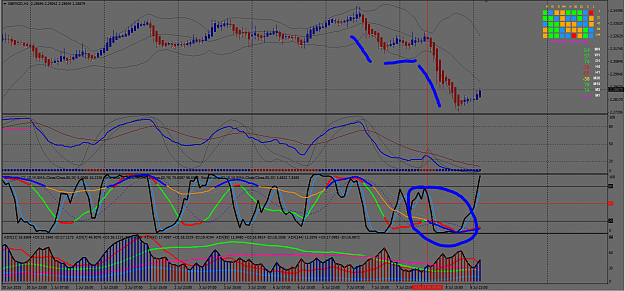
Please.... confirm if my reading is correct for example attached. (I just tracked the move for study purposes only.. I did not enter). I am in doubt relating the ADX as per marked in the image.. Is that the correct color to entry ? (or should be green to increase the odds in my favour even in a short entry) There is a explanation of Songkok some posts behind but I would to reconfirm..
Hi Alien and Thiagorosa, Can you confirm my understanding of the GN entry? On 1h, I see that hours prior to the red vertical line, RSIOMA were coming down and all the stos were coming down. ADX were mixed. on 4h, RSIOMA were crossing 50 as well as green sto crossing 50. I am thinking this is the main consideration for the short? Day chart, RSIOMA still above 80, sto 8 around 70 and falling. again ADX were mixed. Anything else that triggered your short that's important for me to grasp? Thx. {image} {image} {image}
Ignored
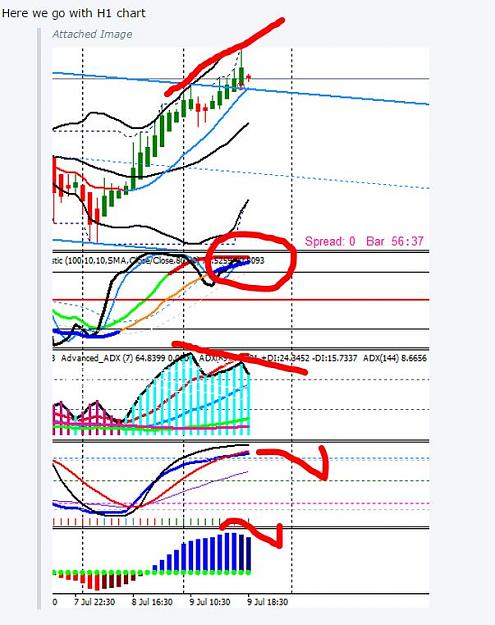
Hi awcharts, at the beginning of the thread this type of trade is explained very well, but let me resume it for you.
You first spoted that on the Daily chart the Rsi and all stos were getting at the top with no space to go up, but even with this condition the price action could have continued to go up and compress the indicators there for a long time, then you droped down to H4 and spotted a bearish divergence on Rsi, green sto or other indicator and this is a indication that the price action are losing the strenght to the upside and is soon to come down, later on, the bollinger bands got compressed on the H4 meaning that the fight between the bulls and the bears were happening and with the clues that you have colected so far you already knew which one are likely to win, you could have stopped the analisis here and waited for the BBs break with the stos and Rsi crossing the 50 line and jumped in on the short trade, but you can always drop down to the lower time frames, especially the M15 in this case and you would have spotted bearish divergence on the indicator too, you could have entered with all the stos and Rsi crossing the 50 line short at a fast speed and get an early enter to get more pips like the print below, this was the beginning of the move, and later on the H1 made the same pattern as you can see you your charts.
{quote} Hi awcharts, at the beginning of the thread this type of trade is explained very well, but let me resume it for you. You first spoted that on the Daily chart the Rsi and all stos were getting at the top with no space to go up, but even with this condition the price action could have continued to go up and compress the indicators there for a long time, then you droped down to H4 and spotted a bearish divergence on Rsi, green sto or other indicator and this is a indication that the price action are losing the strenght to the upside and is...
{quote} Oi Thiago, Nice to finally find a brazilian guy involved with forex issues. Here in So Paulo i tryed hard meeting someone to trade ideas and experience with no sucess. Please.... confirm if my reading is correct for example attached. (I just tracked the move for study purposes only.. I did not enter). I am in doubt relating the ADX as per marked in the image.. Is that the correct color to entry ? (or should be green to increase the odds in my favour even in a short entry) There is a explanation of Songkok some posts behind but I would to...
Ignored
Oi Idris, aqui no Brasil é meio complicado discutir boas idéias de trade mesmo, eles ainda se preocupam muito com números e coisas que não costumam funcionar muito bem .
Sobre sua dúvida, essa janela do indicador que você marcou é do Nihilist, eu não sei ao certo o significado das cores que ele usa, mas lá embaixo na janela do ADX do Alien você poderia mudar a cor das barras para vermelho quando ele estiver criando as ondas de venda e verde para ondas de compra, um pouco antes do inicio desse movimento ali atrás o ADX fez uma onda curta, depois contraiu e começou a segunda onda mais forte, a onda 3, esse é lugar bem seguro pra se entrar.
UJ possible DS trade M15 short: D1 is breaking down, H4 is short with all stos adn Rsi traveling to the 20 zone and good ADX power, H1 with stochs and Rsi under 20 with full Adx power, following M5 and M1 for answers.
Ignored
I have not seen the divergence to the cross trade long, sorry.
Anyone taken the EURUSD today - Looks like I missed the 1H oppertunity - May get in on the 4H.....
Although tempted to get in now :-) Should get up earlier - The early bird catches the Worm..... ( OR PIPS )
On the rise on 5 min will try and get in soon for the short..
Anyone taken the EURUSD today - Looks like I missed the 1H oppertunity - May get in on the 4H..... Although tempted to get in now :-) Should get up earlier - The early bird catches the Worm..... ( OR PIPS ) On the rise on 5 min will try and get in soon for the short..
Ignored
I'm watching EJ...looks like EJ move following EU...but with longer pips
Study the sto's behavior. when they all top or bottom it springs back.
Sometimes to never return and sometimes to continue after a pull back and that is what we need to monitor, continuation or reversal.
I have never posted this , but lots of time when the 21 sto gets over sold or over bought, when the 8,3,3 moves over and touches the 21 sto or crosses. not always but most times PA reverses.
The 8,3,3 hits the top or bottom first , then the 21 catches up with it, as the 8,3,3 moves sideways and intersects with the 21 and turns down to break the 80 level this can be a pretty solid trade, but you have to wait for it on the daily and follow the H4 to be doing the same thing.
The 21 sto needs to have a steep rise or fall to it, not like the 2nd arrow from the left at the bottom of this chart. Although as you see if you wait long enough for the second or third bounce and the 21 going above the 20 level , it can work out also, BUT Alien and Humans always seem to get in Too early and not hold on or place a SL. try it again until PA pops.................
Hi Alien and Thiagorosa, Can you confirm my understanding of the GN entry? On 1h, I see that hours prior to the red vertical line, RSIOMA were coming down and all the stos were coming down. ADX were mixed. on 4h, RSIOMA were crossing 50 as well as green sto crossing 50. I am thinking this is the main consideration for the short? Day chart, RSIOMA still above 80, sto 8 around 70 and falling. again ADX were mixed. Anything else that triggered your short that's important for me to grasp? Thx. {image} {image} {image}
Ignored
On the H1 the 8,3,3 at your red line rubber banded downward and then the 21 sto turn down back below the 20 level. the 8,3,3 was having a hard time to go long so PA reversed and fell hard and long.
All that you have pointed out made a good signal....................or at least a good chance to try with SL 100 pips
{quote} Hi awcharts, at the beginning of the thread this type of trade is explained very well, but let me resume it for you. You first spoted that on the Daily chart the Rsi and all stos were getting at the top with no space to go up, but even with this condition the price action could have continued to go up and compress the indicators there for a long time, then you droped down to H4 and spotted a bearish divergence on Rsi, green sto or other indicator and this is a indication that the price action are losing the strenght to the upside and is...
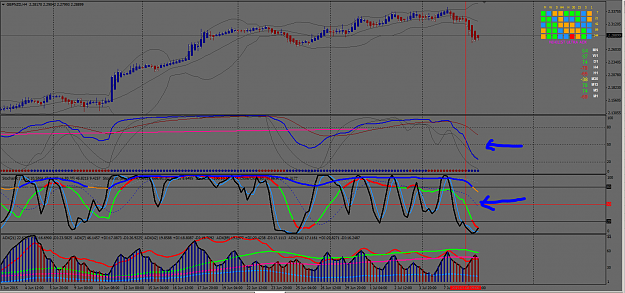
This is my first analysis. I am sharing my H4 chart and H1 and M15 chart. In H4, I could see the riosma is climbing up, but in H1, I could see stochastic and riosma are above over bought level. Is it right time to enter one short here.
Hello, This is my first analysis. I am sharing my H4 chart and H1 and M15 chart. In H4, I could see the riosma is climbing up, but in H1, I could see stochastic and riosma are above over bought level. Is it right time to enter one short here. {image}
Ignored
This H4 chart tells me long for now 21 sto crossing above the 50 level , adx expanding, RSIoma turning up,
The H1 chart shows me Divergence with PA and the ADX 7, sto's are topping, RSIoma is topping , but could stay there for awhile.
Your M15 has topped for now, you could place a short here, with a SL. It would be best to wait for the next move up on this chart and if the PA does not go higher, then it is a better place to short.
Just keep in mind the market can always turn around, so this is why we monitor it every 4 to 8 hours, trade larger TF's and you only need to watch it twice a day.