Yes. Last week at Opening Bell, Gavin mentioned that at 1H chart there's sign of weakness. Whenever price hit 1355 there would be sell with high volume.
{quote} Yes. Last week at Opening Bell, Gavin mentioned that at 1H chart there's sign of weakness. Whenever price hit 1355 there would be sell with high volume.
Ignored
cool - I don't follow Gavin but he is very good - But weakness on the hours is one thing BUT on the week day and 4 hours is something else
I have been trading it all week
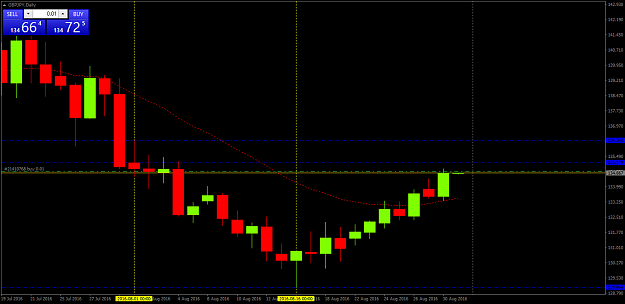
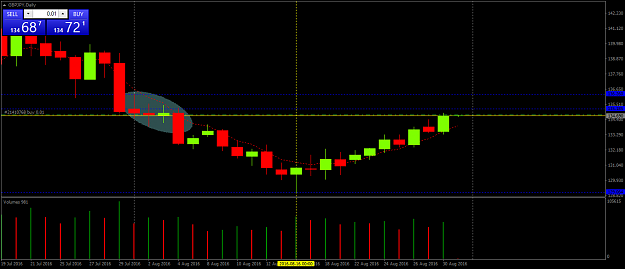
With your VSA strategy is it possible to spot the turning points of a trend (low and high)?
On GBP/JPY daily TF, the swing low happened on 16/8/2016.
Where will be the next swing high?
Probably the long trade will fail because I missed to consider the supply zone highlighted.
Hello TEB63 With your VSA strategy is it possible to spot the turning points of a trend (low and high)? On GBP/JPY daily TF, the swing low happened on 16/8/2016. Where will be the next swing high? Cheers. Merka {image}
Ignored
of Course many times - not always
BUT
(a) I need volume
(b) 5 MA looks like you have a 20 MA
{quote} of Course many times - not always BUT (a) I need volume (b) 5 MA looks like you have a 20 MA we can see a trend change on the day you speak of {image}
Ignored
I updated my previous post.
After I placed the long trade, I realized that I missed the supply zone highlighted in grey so, probably this long trade will fail.
cheers
Merka
{quote} I updated my previous post. After I placed the long trade, I realized that I missed the supply zone highlighted in grey so, probably this long trade will fail. cheers Merka
Ignored
very likely I think its more the close of key bar then the area you greyed
{quote} of Course many times - not always BUT (a) I need volume (b) 5 MA looks like you have a 20 MA we can see a trend change on the day you speak of {image}
Ignored
That key bar is the BREXIT bar about UK leaving EUR zone.
The new trend from 16/08/2016 is going to continue for tomorrow or there are sign in the volume that it will be over?
{quote} That key bar is the BREXIT bar about UK leaving EUR zone. The new trend from 16/08/2016 is going to continue for tomorrow or there are sign in the volume that it will be over? I need to learn more about your technique.
Ignored
I do it the other way around
I read for signs not read pairs
In this case I do not see any trades on the day chart on this pair at all
But I would only trade short because of Key Bar
As to your 1st post we do see short term counter trades ( bottom) but I would not trade them
{quote} I do it the other way around I read for signs not read pairs In this case I do not see any trades on the day chart on this pair at all But I would only trade short because of Bar 1 As to your 1st post we do see short term counter trades ( bottom) but I would not trade them teb