Daily Lines/Boxes indicator: Terms and Conditions
All code is supplied FREE of charge. It may NOT be sold or distributed commercially. Unless otherwise shown, no source code is available.
Software is offered on an 'as is' basis. I'm not offering a programming or troubleshooting service.
There is no guarantee that the software is fit for purpose, or free of errors. Download and use the indicator(s) at your own risk; I accept no liability for computer damage or financial losses.
___________________________
Instructions
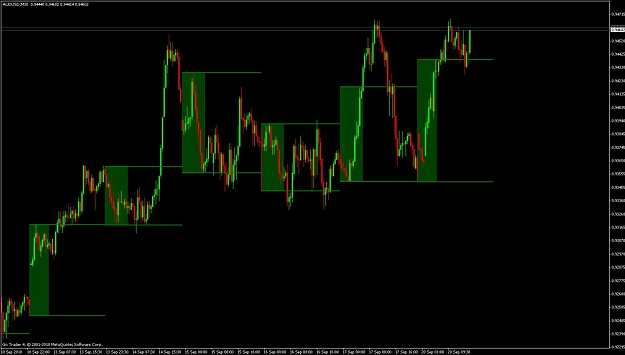
The attached indicator will draw filled or unfilled boxes, and/or vertical or horizontal lines, the same time period for each day of the week that you specify. It can be used to plot breakout boxes, session delimiters, S/R lines, etc. It can now also plot Wingding symbols above/below candles also.
Download it into your ...../MQL4/Indicators folder.
Note: If you download the .mq4 source, then you must do this first, if you want the indicator to compile/run correctly.
Parameters
LookbackDays - number of days to plot the boxes/lines for, counting back from the current date. Each day is assumed to start and end at midnight (MT4 time). If you want to plot boxes/lines back to the beginning of the chart, set its value to a large number like 999999; it will not attempt to plot objects beyond the first candle in the chart.
StartHours
EndHours
ExtendHours - this is the hour of the day (MT4 time). A value of 0 is midnight. A positive number refers to X hours after midnight, e.g. 5 = 0500 hours. Use negative numbers to plot back into the previous day, e.g. -5 = 1900 hours. You may also include decimal values, e.g. 4.5 = 0430 hours, -6.25 = 1745 hours; and you can also extend lines/boxes into future or prior days by using values greater than 24 or less than -24, e.g. 40 = 1600 hours into the following day.
- Boxes are plotted from StartHours to ExtendHours, unless the 'T' property is included in Properties, in which case they are truncated at EndHours. The upper and lower extremities of each box are determined by the highest and lowest prices between StartHours and EndHours. (Note/hint: you can make EndHours and ExtendHours the same value).
- Twin Horizontal lines are plotted from StartHours to ExtendHours, using the highest and lowest prices between StartHours and EndHours.
- Vertical lines are plotted at StartHours, and (if the 'VV' property is included) at ExtendHours also.
UniqueID - you can plot multiple regions or sessions by attaching multiple instances of the indy to the same chart, but you must give each instance a different UniqueID.
BoxColor
LineColor - the colors that will be used to plot the boxes, and lines, respectively.
Properties - include any combo of the following characters (upper or lowercase), in any order:
Z = plot twin horizontal lines (from the highest high and lowest low between StartHours and EndHours)
Y = same as Z except the lines are plotted between the candle highest body (open/close) and lowest candle body (open/close) between StartHours and EndHours
C = plot a single horizontal line from the close of the candle at StartHours
O = plot a single horizontal line from the open of the candle at StartHours
H = plot a single horizontal line from the high of the candle at StartHours
L = plot a single horizontal line from the low of the candle at StartHours
A = plot a single horizontal line from the midpoint (average of the high and low) of the candle at StartHours
X = extend horizontal lines (as rays) to the RHE of the chart (useful for plotting daily/session highs/lows as S/R)
V = plot a single vertical line (V^ plots a single vertical line without its extending into sub-windows below the main chart)
VV = plot twin vertical lines (VV^ plots twin vertical lines without their extending into sub-windows below the main chart)
B = plot a box (default is unfilled)
F = plot a filled box
T = truncate box at EndHours
P = display box height (in pips). Must have object descriptions switched on (press F8, on Common tab). Alternatively, you can use TextProperties to display box heights (explained below).
> (greater than symbol) = plot the box between the open price at the StartTime, to the highest price in the time interval enclosed by the box
< (less than symbol) = plot the box between the open price at the StartTime, to the lowest price in the time interval enclosed by the box
Integer between 1 and 5 = line/box width
Line/box style is assumed to be solid, unless any one of the following tokens is included:
-- = dashed
. = dotted
-. = dash-dot ('N' in Morse code ![]() )
)
-.. = dash-dot-dot ('D' in Morse code ![]() )
)
E = determine the highest volume candle between StartHours and EndHours. Then plot a horizontal line, between StartHours and ExtendHours, from the high and low of this candle
R = determine the highest range candle between StartHours and EndHours. Then plot a horizontal line, between StartHours and ExtendHours, from the high and low of this candle
M = find the candle, between StartHours and EndHours, whose volume multiplied by its range has the greatest value. Then plot a horizontal line, between StartHours and ExtendHours, from the high and low of this candle
D = find the candle, between StartHours and EndHours, whose volume divided by its range has the greatest value. Then plot a horizontal line, between StartHours and ExtendHours, from the high and low of this candle
W = plot a Wingdings symbol above/below the candle at StartHours (see SymbolProperties for details)
WW = plot two Wingdings symbols; one above/below the candle at StartHours, the other above/below the candle at ExtendHours (see SymbolProperties for details)
HorizLineLevels - this applies only to the single horizontal line plotting options (Properties = C, O, H, L or A). Multiple horizontal lines will be drawn X pips above/below the Close, Open, High, Low or Average point of the candle specified by StartHours. Up to 99 levels may be specified, separated by commas. For example (and if Properties = C), an entry of -10,0,20 would plot lines at 10 pips below the close price, the close price itself, and 20 pips above the close price. An entry of 0 would simply plot a single horizontal line from the close price
TextProperties - blank out this field unless you want informational text displayed above/below the box. If the latter (which is an alternative to setting Properties = P), the format for this parameter is <fontname>,<fontsize>,<fontcolor>,<vertspacing>,<data type>,<format 1>,<format 2>,<horiz shift> in that order, separated by commas:
<fontname> = must be the name of a valid installed Windows font, and is case sensitive
<fontsize> = an integer that determines the size of the text
<fontcolor> = must be either a valid MT4 color token (e.g. Green, SaddleBrown, Goldenrod, CornflowerBlue, etc), or a custom entry like RnnnGnnnBnnn, e.g. G255R255 (green=255, red=255, no blue) is the same as Yellow.
<vertspacing> = the number of pips above the box high, or below the box low, where the text will be displayed. Positive value = above the high; negative value = below the low.
<data type> valid entries are P=height of box in pips; H=price at Highest point of box; L=price at Lowest point of box; S=price at open of Start candle; E=price at close of End candle; X=price at close of Extend candle. You may use upper or lowercase, multiple entries (e.g. HL) are permitted
<format 1> = format for the date/time, if you want it output; leave blank otherwise
<format 2> = format for the value (#pips,high,low,start,end,extend price)
See here for detailed info on format masks
<horiz shift> = how many candles (positive number = rightward; negative number = leftward) to shift the text, to get the desired horizontal location
SymbolProperties - this is relevant only if you've entered W or WW in the Properties setting. The format for this parameter is <symbolsize>,<symbolcolor>,<symbolnumber>,<vertspacing> in that order, separated by commas:
<symbolsize> = an integer (1 thru 5) that determines the size of the plotted symbols
<symbolcolor> = determines the colors of the plotted symbols. Must be either a valid MT4 color token (e.g. Green, SaddleBrown, Goldenrod, CornflowerBlue, etc), or a custom entry like RnnnGnnnBnnn, e.g. G255R255 (green=255, red=255, no blue) is the same as Yellow.
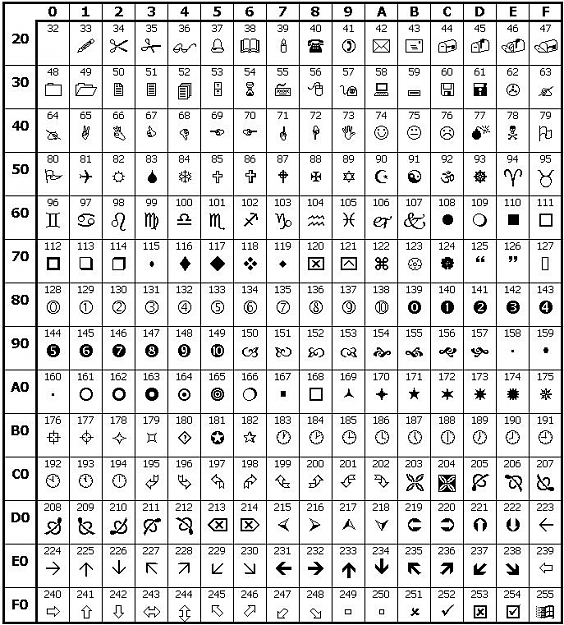
<symbolnumber> = the Wingdings symbol number. See the table attached to this post.
<vertspacing> = the number of pips above the candle high, or below the candle low, where the symbol will be displayed. Positive value = above the high; negative value = below the low.
DaysOfWeek - which days of the week you want the boxes/lines plotted. Use the first three characters of the name, e.g. Mon, Tue, Sat. Upper or lowercase, separated by commas. (Example: If you want to plot a vertical line at weekly open, set DaysOfWeek = Mon. If you want weekly opens as blue lines, and other daily opens as red lines, attach two instances of the indicator: (1) DaysOfWeek = Mon (2) DaysOfWeek = Tue,Wed,Thu,Fri).
DaysOfMonth - which days of the month you want the boxes/lines plotted. Simply modify the existing list; entries must be separated by commas.
Visibility - which timeframes you want the boxes/lines to appear on. Upper or lowercase, separated by commas. Valid entries are M1, M5, M15, M30, H1, H4, D1, W1, MN
TimeFrame - which timeframe's candles will be used to determine the highs/lows across the window between StartHours and EndHours. Valid entries are M1, M5, M15, M30, H1, H4, D1, W1 or MN (upper or lowercase). Or if you leave the field blank, it defaults to the current chart's timeframe.
CandlesMustExist - if set to true, and a candle of the required time does not exist, no line will be plotted.
ClearancePips - allows the boxes or horizontal lines to be plotted/extended X pips above the price high, and below the price low. Useful for plotting box breakouts, where the trade entry point is X pips above/below the box
RefreshPeriod - this determines how often MT4 replots the boxes/lines, allowable values are explained here.
SecondaryPipCount -
--- if TRUE, up to two additional horizontal lines are plotted between EndHours and ExtendHours, at the high and low of this period, if this high and/or the low exceed(ed) the high and/or low of the period between StartHours and EndHours, for the same day. These additional lines are plotted using the same parameters (color, width, style, ray, visibility) as the 'parent' lines. Both the 'high' line and 'low' line operate independently of each other, e.g. if the high is exceeded but not the low, then only the 'high' line will be plotted. Additionally, if TextProperties is non-blank, then the number of pips by which the high and/or low was exceeded is displayed above/below the line, and the line is plotted using the same color as the text
--- if FALSE (the default value), none of the above is performed
UniqueID - If you want to attach two or more instances of the indicator to the same chart, you must give each instance a different UniqueID value. Failure to do so will cause unpredictable results, as each instance will become confused as to which plotted objects belong to it, and which objects belong to other instances.
NOTE: The screenshot below is the result of setting Properties = FTZ2